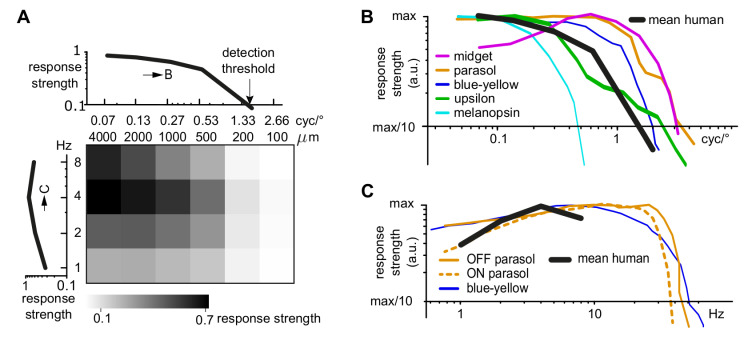
Fig 3. Human retinal ganglion cells show similar spatial and temporal frequency response curves as non-human primate retinal ganglion cells.
(A) Heat map: Average responsivity of human retinal ganglion cells for drifting sinusoidal gratings, replicated from Fig 1E (N = 293). Curves: Spatial frequency (top) and temporal frequency (left) response curves (mean across all cells). (B, C) Spatial and temporal response curve in comparison with published data on non-human primate ganglion cells. Non-human primate data adapted from [40] (midget); [41, 42] (parasol); [41, 43] (blue-yellow); [25] (upsilon); [28] (melanopsin).

