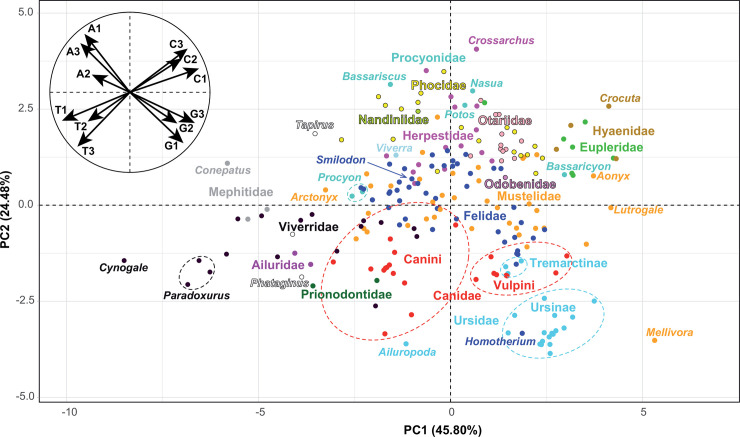
Fig 1. Variation in base composition of the mitogenomes of Carnivora.
The PCG-mtDNA dataset was used to calculate the frequency of the four bases (A, C, G and T) at each of the three codon positions, and the 12 variables measured were then summarized by a principal component analysis (PCA). The main graph represents the individual factor map based on 220 taxa. The families of Carnivora are highlighted by different colours. The small circular graph at the top left represents the variables factor map.

