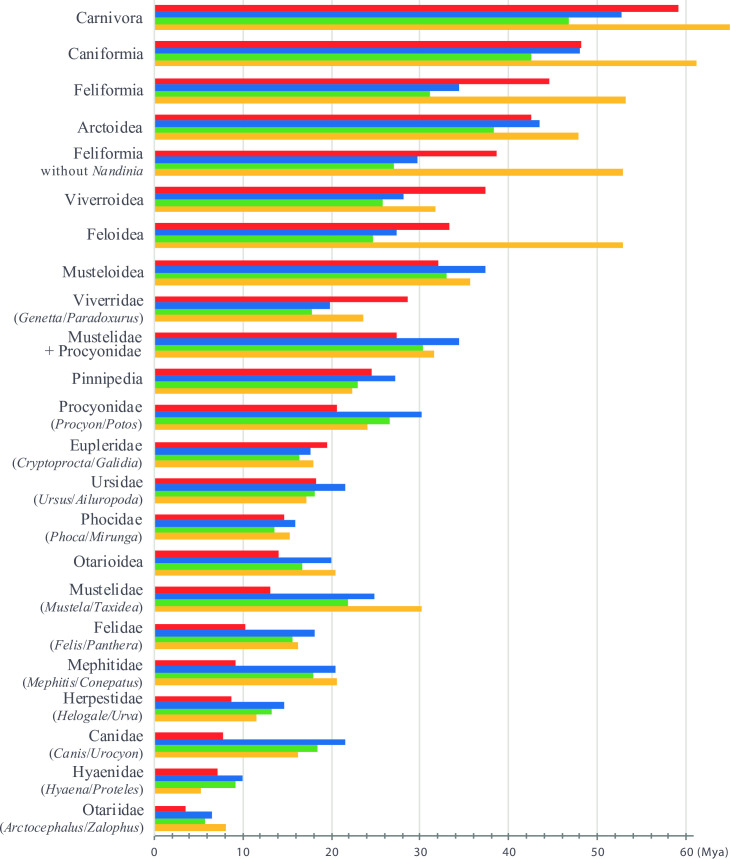
Fig 4. Comparison with published chronograms on Carnivora.
The mean divergence times were here estimated with two approaches for the prior distribution on the calibrated node ages: (1) a uniform distribution between maximum and minimum boundaries (“U approach”, blue histograms); and (2) a log-normal distribution (“L approach”, green histograms) (see main text for details). The results were compared with mean ages inferred in Eizirik et al. [9] (red histograms) and Nyakatura and Bininda-Emonds [10] (orange histograms).

