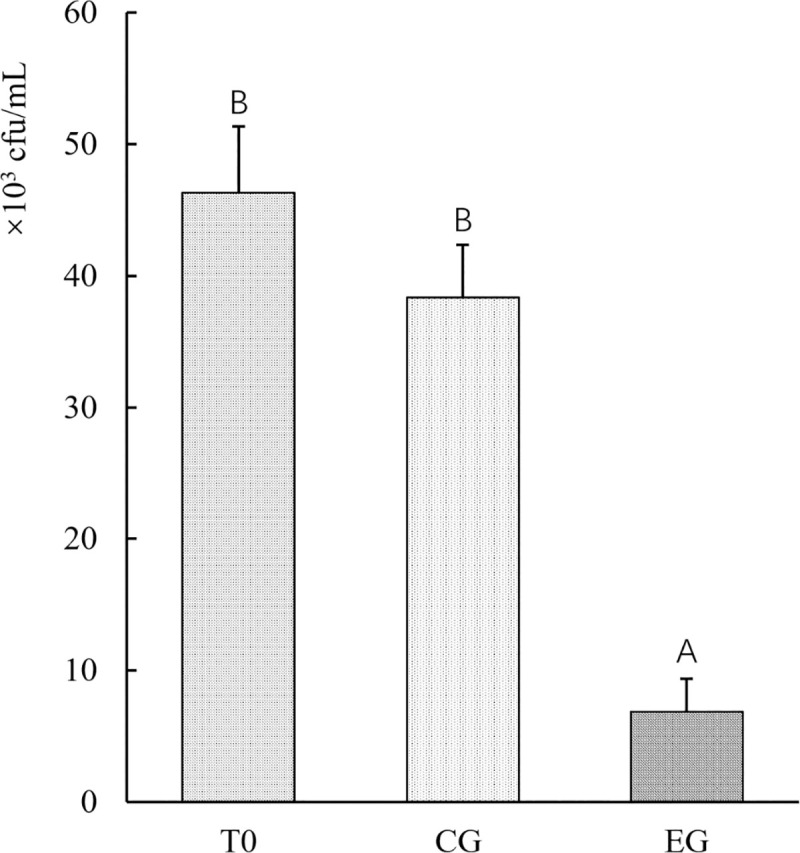
Fig 5. The number of Vibrio cells in farming water after 48-h incubation.

T0: the start of experiment at 0 h; CG: the control group without the supplement of the yeast YLY01; EG: the experimental group supplemented by the yeast YLY01. Data are given as mean ± SD (n = 3). Different letters above bars indicate significant difference among treatments (p < 0.05).
