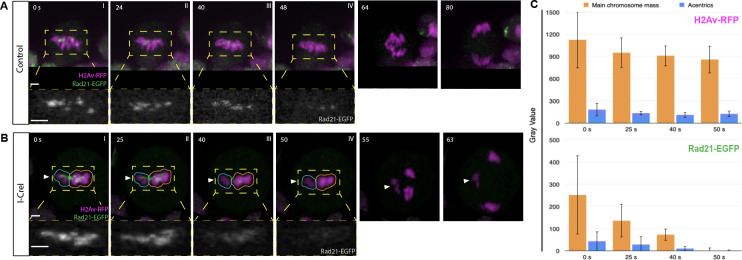
Fig 2. Cohesin complexes are cleared off of acentric sisters upon anaphase onset.
Chromosomes labeled with H2Av-RFP (magenta) and cohesin labeled with Rad21-EGFP (green). (A) Stills from a time- lapse movie of a control mitotic neuroblast. (B) Still images from a time-lapse movie of a mitotic neuroblast with I-CreI-induced acentrics (S1 Data). Acentrics (arrowhead) lag on the spindle equator. (C) Bar graphs of a compilation of five videos of I-CreI- expressing neuroblasts showing the relative fluorescence intensities in arbitrary units (AU) of chromosomes (H2Av-RFP, top) cohesin (Rad21-EGFP, bottom) around acentrics (cyan outlined region) and the main mass of chromosomes (yellow outlined region) at time points 50, 40, 25, 0 s, prior to anaphase onset, respectively. Bars, 2 μm. Time in seconds. Error bars represent standard deviations of fluorescence intensities at all points tested.

