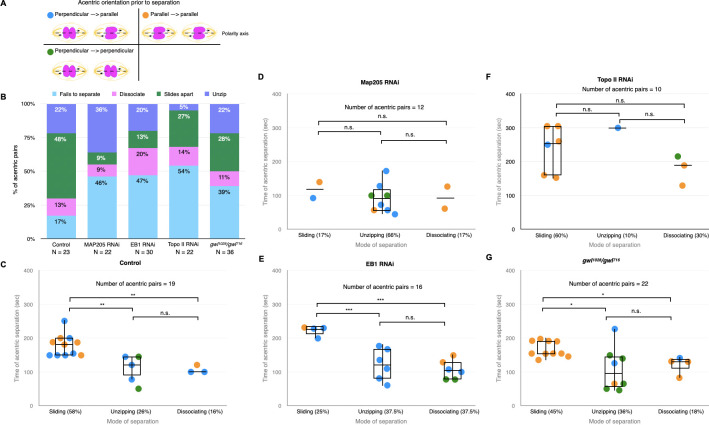
Fig 5. Knockdowns of EB1 and Map205 preferentially disrupt the sliding mode of acentric separation.
(A) Model of different acentric orientations prior to separation. Polarity axis indicated by the dotted line. (B) Bar graph showing the percentage of acentric pairs that separate via simultaneous dissociation, sliding, or unzipping and the percentage of those that fail to separate. (C-G) Measurements of the frequency of each mode of acentric sister separation (x-axis) and the timing of acentric sister separation after the separation of intact chromosomes (y-axis). Each dot represents one acentric pair. Blue dots represent acentric pairs that were oriented perpendicular then parallel to the polarity axis prior to separation. Orange dots represent acentric pairs that were oriented parallel to the polarity axis prior to separation. Green dots represent acentric pairs that were oriented perpendicular to the polarity axis prior to separation. Boxes show interquartile ranges and lines show medians of the measured data. Asterisks indicate statistical significance (*P = 0.01, **P = 0.005, ***P = 0.009) when comparing the timing of acentric separation between separation modes. Statistical analysis was done using two-sided Mann-Whitney tests. Non-significant values had a P-value greater than 0.05.

