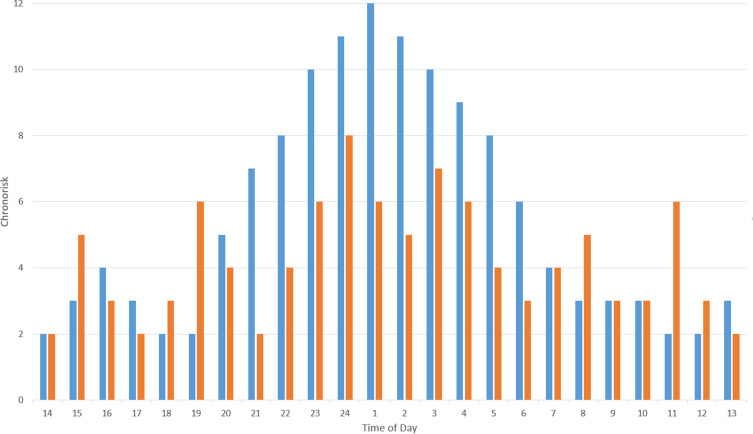
Figure 1.
Representative chronorisk analysis of episodic (eCH, blue bars) and chronic (cCH, orange bars) cluster headache patients showing peaks of chronorisk during the 24 hours of the day. Chronic patients have more peaks throughout the day indicating more ultradian oscillation in chronorisk compared to eCH. A detailed description of the methodology behind this analysis is available in references.30,36

