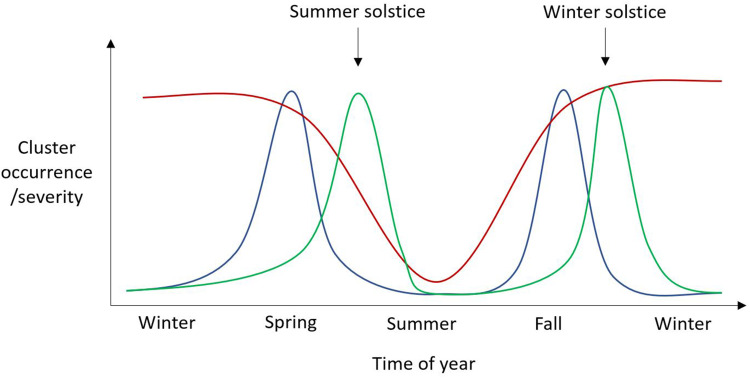
Figure 2.
Schematic representation of three possible annual patterns of cluster occurrence/severity. Red line – cluster occurrence/severity improves during the summer months, possibly due to number of daylight hours. Blue line – Clusters occur during the spring and autumn months. Green line – clusters occur around the time of the solstices, possibly due to an inability to synchronize the internal circannual pacemaker.

