. 2020 Dec 29;9:e62238. doi: 10.7554/eLife.62238

Figure 5. Viral evolution is driven by selection for an intracellular competitive advantage.

(A) Relative fitness of viral variants in pairwise competition with the ancestor (K+I+) and virus-cured ancestor (K-I-). Killer phenotype and identity of viral variant labeled above (Kw indicates weak killing ability). Killer phenotype of the ancestral competitor labeled below. Starting frequency indicated by color. (B) Change to killer phenotype during intracellular competitions between viral variants (by color) and ancestral virus. Replicate lines indicated by symbol. (C) Variant frequency during intracellular competitions. Colors and symbols consistent with panel B. Inset: frequency of the de novo G131D viral variant.

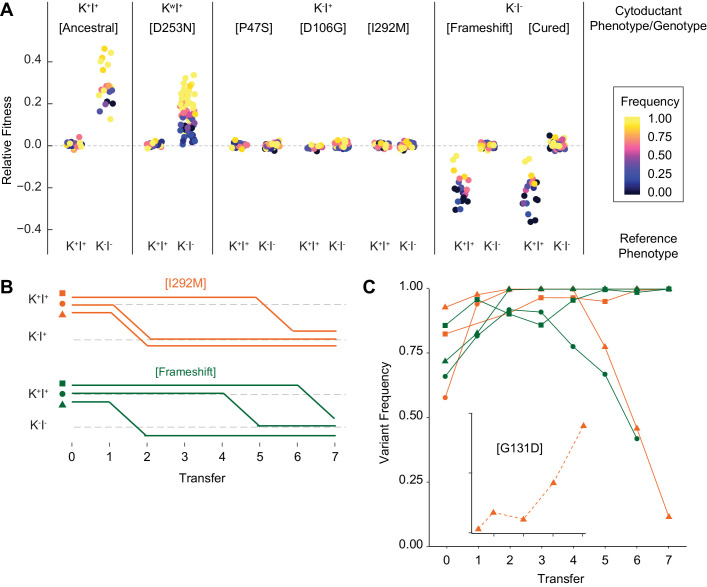
Figure 5.

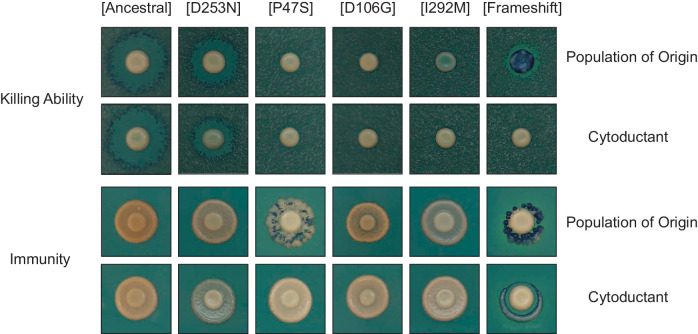
Figure 5—figure supplement 1. Cytoductants exhibit the same killer phenotype as the population of origin.

Figure 5—figure supplement 1.

Viral variants were transferred from evolved populations to a cured ancestor. Halo assays demonstrate that killer phenotypes were consistent between donor and recipient strains. Viruses were obtained from the following evolved populations at Generation 1000: BYS1-A03 (D253N), RMB1-A02 (P47S), BYB1-H06 (D106G), BYS1-A05 (I292M), and BYS2-B09 (frameshift). Populations RMB1-A02 and BYS2-B09 appear mixed given the observed speckling pattern.
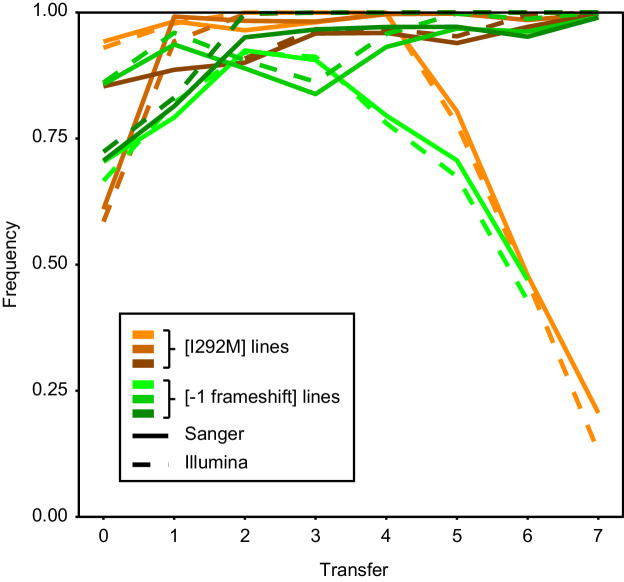
Figure 5—figure supplement 2. Consensus between Sanger and Illumina sequencing in reporting mutation frequency.

Figure 5—figure supplement 2.

Intracellular competitions were tracked over time by both Sanger and Illumina sequencing.