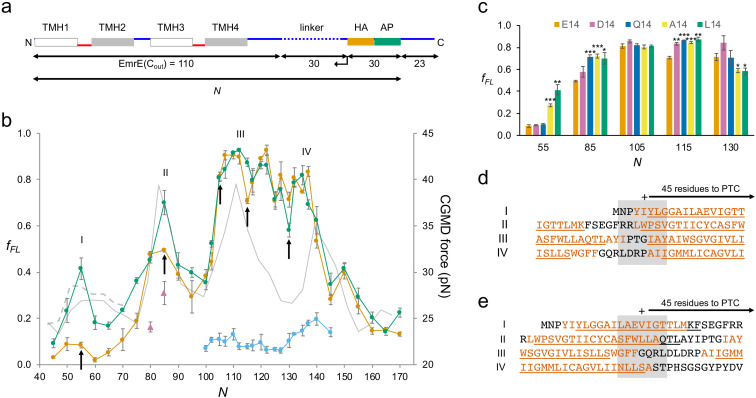
Figure 2. EmrE(Cout).
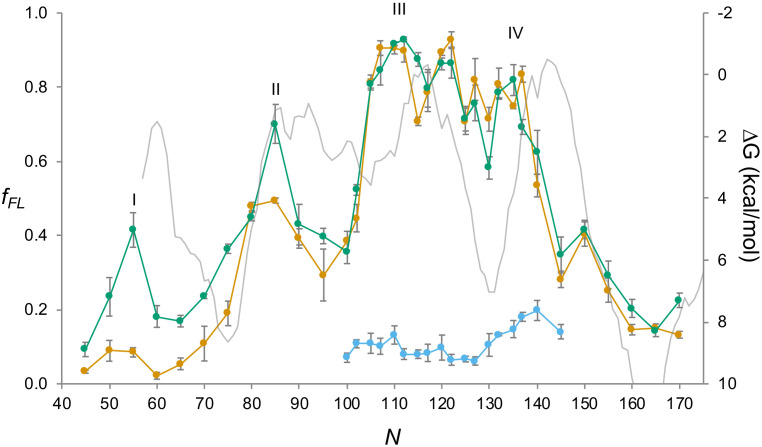
(a) Construct design. EmrE(Cout) is shortened from the C-terminal end of the LepB-derived linker (dotted), as indicated by the arrow. Cytoplasmic (red) and periplasmic (blue) loops, and lengths of full-length EmrE(Cout), LepB-derived linker, HA tag + arrest peptide (AP), and C-terminal tail, are indicated. Since the 30-residue HA + AP segment is constant in all constructs, the force profile (FP) reflects nascent chain interactions occurring mainly outside the ribosome exit tunnel. (b) FPs for EmrE(Cout) (orange), EmrE(Cout,E14L) (green), EmrE(Cout) with SecM(Ec-sup1) AP (blue), EmrE(Cout, I37I38→NN) (magenta triangles), and coarse-grained molecular dynamics (CGMD-FP) calculated with a −100 mV membrane potential (gray). (c) Effects of mutations in E14 on fFL values for the N values are indicated by arrows in (b). p-values (two-sided t-test): *p < 0.05; **p < 0.01; ***p < 0.001. (d, e) Sequences corresponding to peaks I–IV aligned from their Nstart (d) and Nend (e) values. The + sign indicates 45 residues from the polypeptide transferase center (PTC). Hydrophobic transmembrane helix (TMH) segments are shown in orange and transmembrane α-helices underlined (PDB: 3B5D). Error bars in b and c indicate SEM values.


