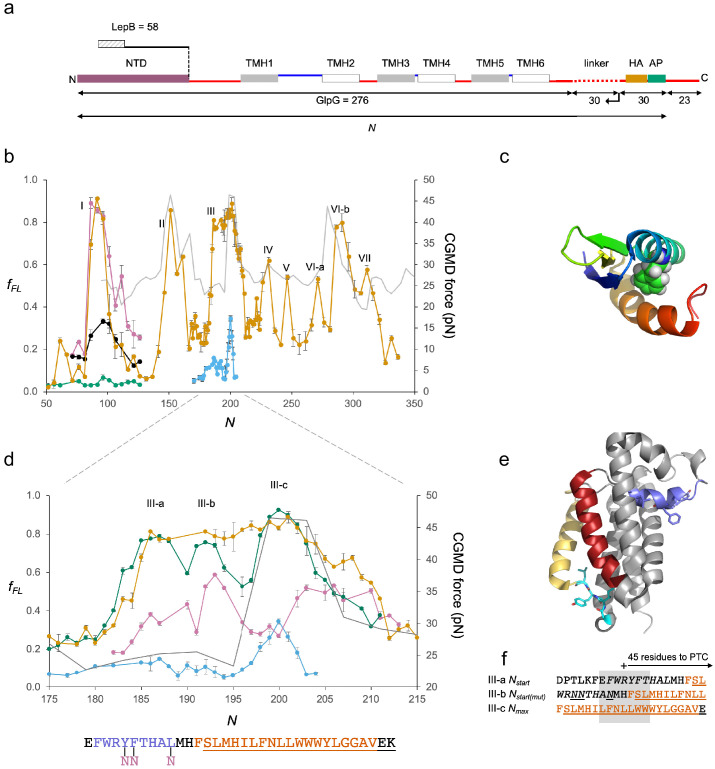
Figure 3. GplG.
(a) Construct design, c.f., Figure 2a. The N-terminal LepB fusion is indicated. (b) Force profiles (FPs) for GlpG and LepB-GlpG (N = 131–224) (orange), NTD(F16E) (green), in vitro translated N-terminal domain (NTD) (magenta), and NTD(F16E) (black), LepB-GlpG with SecM(Ec-Sup1) AP (blue), and coarse-grained molecular dynamics (CGMD)-FP calculated with a −100 mV membrane potential (gray). Error bars indicate SEM values. Note that the LepB-GlpG constructs are two residues shorter than the corresponding GlpG constructs but are plotted with the same N values as the latter to facilitate comparison. (c) NTD (PDB ID: 2LEP), with F16 in spacefill. (d) Enlarged FPs for LepB-GlpG with SecM(Ec) AP (orange), SecM(Ec-Ms) AP (green), SecM(Ec-sup1) AP (blue), and GlpG(Y138F139L143→NNN) with SecM(Ec-Ms) AP (magenta). CGMD-FP in gray. (e) Structure of GlpG with the periplasmic surface helix in blue, TMH2 in red, the membrane-associated cytoplasmic segment in cyan, and TMH5 in yellow. Y138F139L143 and G222I223Y224L225 are shown as sticks. (f) LepB-GlpG peak III-a and III-c sequences aligned, respectively, from their Nstart and Nmax values, and the mutant LepB-GlpG(Y138F139L143→NNN) peak III-c sequence aligned from its Nmax value. Hydrophobic transmembrane helix (TMH) segments are shown in orange and transmembrane α-helices (PDB: 2IC8)underlined. The periplasmic surface helix is italicized. AP: arrest peptide; PTC: polypeptide transferase center.


