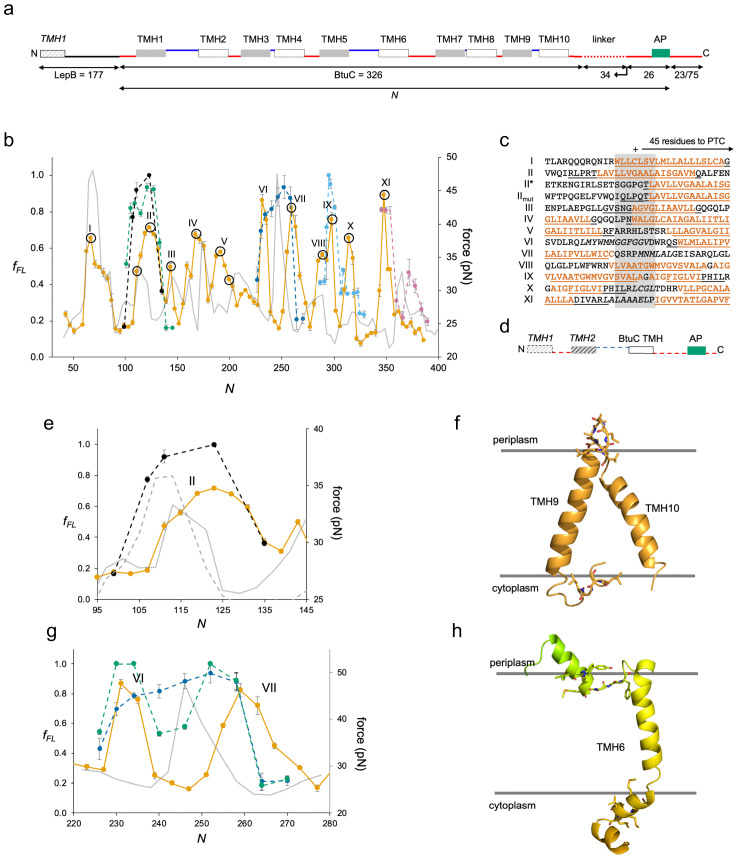
Figure 4. BtuC.
(a) Construct design, cf. Figure 2a. The N-terminal LepB fusion is indicated. N values are calculated from the N-terminus of BtuC. For constructs with N ≥ 298, the C-terminal tail is 75 residues long. Circles indicate constructs for which mutations were made in the corresponding transmembrane helix (TMH) (see Figure 4—figure supplement 2. (b) Force profiles (FPs) for BtuC (orange), BtuC-TMH2 (green), BtuC(R47R56R59→QQQ) (black), BtuC-TMH6 (dark blue), BtuC-TMH8 (blue), BtuC-TMH10 (pink), and CGMD-FP calculated with a −100 mV membrane potential (gray). Error bars indicate SEM values. Note that the BtuC-TMH2, BtuC-TMH6, BtuC-TMH8, and BtuC-TMH10 constructs are plotted with the same N values as the corresponding BtuC constructs to facilitate comparison (i.e., the number of residues between the TMH in question and the last residue of the AP is the same in both types of constructs, see Supplementary file 1). (c) Sequences corresponding to peaks I–XI aligned from their Nstart values. Hydrophobic TMH segments are shown in orange and membrane-embedded α-helices according to the OPM database (Lomize et al., 2012) underlined. Re-entrant loops and surface helices discussed in the text are italicized. (d) Construct design for obtaining FPs of isolated Nout-oriented BtuC TMHs. Dashed segments are derived from LepB. (e) Enlarged FPs for BtuC (orange) and (R47R56R59→QQQ) (black), together with coarse-grained molecular dynamics (CGMD)-FPs calculated with (gray) and without (dashed gray) a −100 mV potential. (f) BtuC TMH9-TMH10, with hydrophobic flanking residues in stick representation (PDB ID: 2QI9). (g) Enlarged FPs for BtuC (orange), isolated TMH6 (residues 187–206; blue), and isolated TMH5-6 (residues 138–206; green). In the latter construct, LepB TMH2 was not included in order to maintain the correct membrane topology of the BtuC TMH5-TMH6 part. The CGMD-FP is in gray. (h) Structure of TMH6 including the upstream periplasmic re-entrant helix and the downstream cytoplasmic surface helix, with hydrophobic flanking residues in stick representation. AP: arrest peptide; PTC: polypeptide transferase center.


