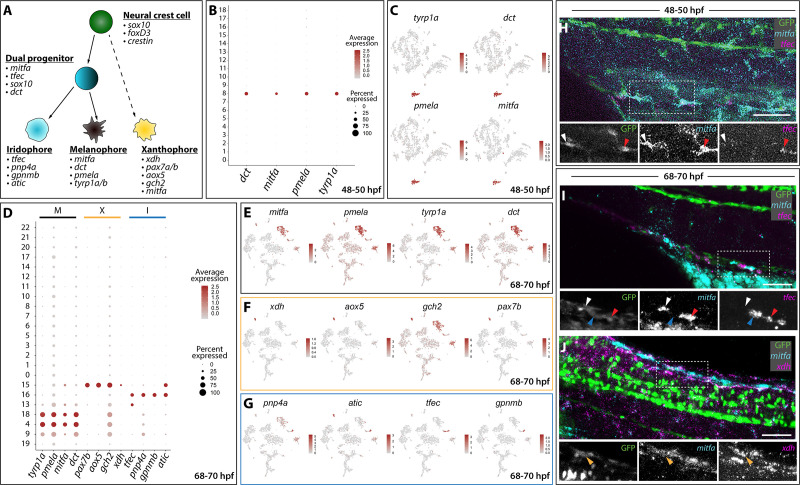
Figure 2. Distinct pigment cell populations are present among sox10:GFP+ cells during embryonic to larval transition.
(A) Cartoon schematic depicting the model for neural crest delineation into pigment cell lineages and the genes that were used to identify each pigment cell population. (B) Dot plot identifying melanophore markers within the 48–50 hpf dataset. Dot size depicts the cell percentage for each marker within the dataset and the color summarizes the average expression levels for each gene. (C) tSNE plots depicting melanophore signature in the 48–50 hpf dataset. Relative expression levels are summarized within the color keys, where color intensity is proportional to expression level of each gene depicted. (D) Dot plot showing distinct pigment chromatophore markers within the 68–70 hpf dataset. Dot size depicts the cell percentage for each marker within the dataset and the color summarizes the average expression levels for each gene. M: melanophore markers; X: xanthophore markers; I: iridophore markers. (E–G) tSNE plots revealing the location of melanophores (E), xanthophores (F), and iridophores (G) in the 68–70 hpf dataset. Relative expression levels are summarized within the color keys, where color intensity is proportional to expression level of each gene depicted. (H) HCR against mitfa and tfec at 48–50 hpf reveals mitfa+ melanophores (white arrowhead) and mitfa+/tfec+ pigment progenitors (red arrowhead). Cropped panels show individual fluorescent channels. (I) HCR against mitfa and tfec at 68–70 hpf presents mitfa+ melanophores (white arrowhead), tfec+ iridophores (blue arrowhead), and mitfa+/tfec+ pigment progenitors (red arrowhead). Cropped panels show individual fluorescent channels. (J) HCR against mitfa and xdh at 68–70 hpf shows mitfa+/xdh+ xanthophores (orange arrowhead). Cropped panels show individual fluorescent channels. Scale bar in H-J: 50 µm.

