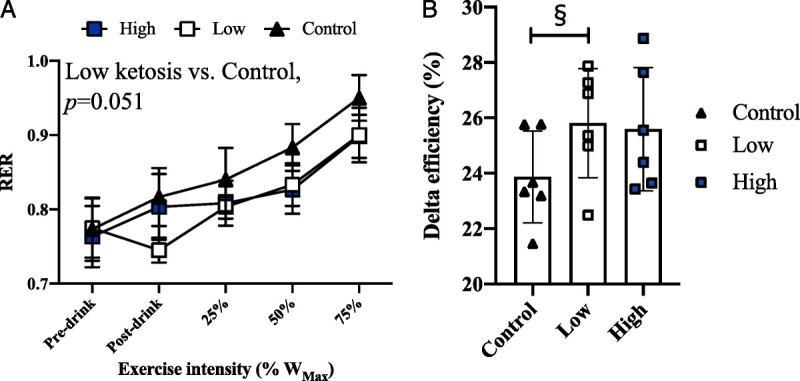
FIGURE 2.

RER and exercise efficiency in the control, low-ketosis, and high-ketosis conditions. A, RER at rest and during exercise (mean ± SD). B, Delta efficiency (in percent), representing the relationship between energy expended per minute vs work accomplished per minute during exercise (mean ± SD). §Significant difference between control and low-ketosis conditions.
