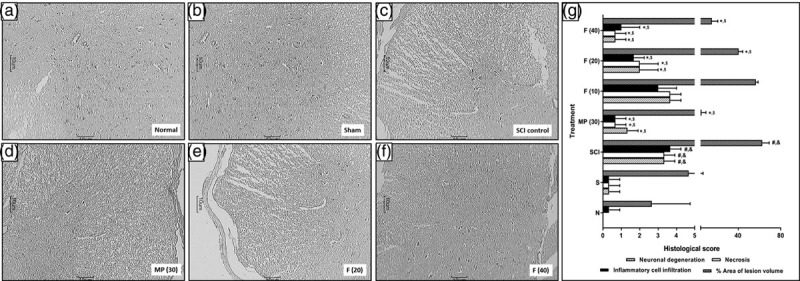
Fig. 4.

Effect of fisetin on SCI-induced alteration in spinal cord histology Spinal cord microscopic image of normal rat (a), sham control rat (b), SCI control rat (c), methylprednisolone (30 mg/kg) treated rat (d), fisetin (20 mg/kg) treated rat (e) and fisetin (40 mg/kg) treated rat (f). Spinal cord sections stained with H&E. Images at 40× are typical and representative of each study group. Data are expressed as mean ± SEM (n = 3), and one-way ANOVA followed by the Kruskal–Wallis test was applied for post hoc analysis. *P < 0.05 as compared to SCI control group, #P < 0.05 as compared with sham group, &P < 0.05 as compared with normal and $P < 0.05 as compared with one another. ANOVA, analysis of variance; H&E, hematoxylin and eosin; SCI, spinal cord injury.
