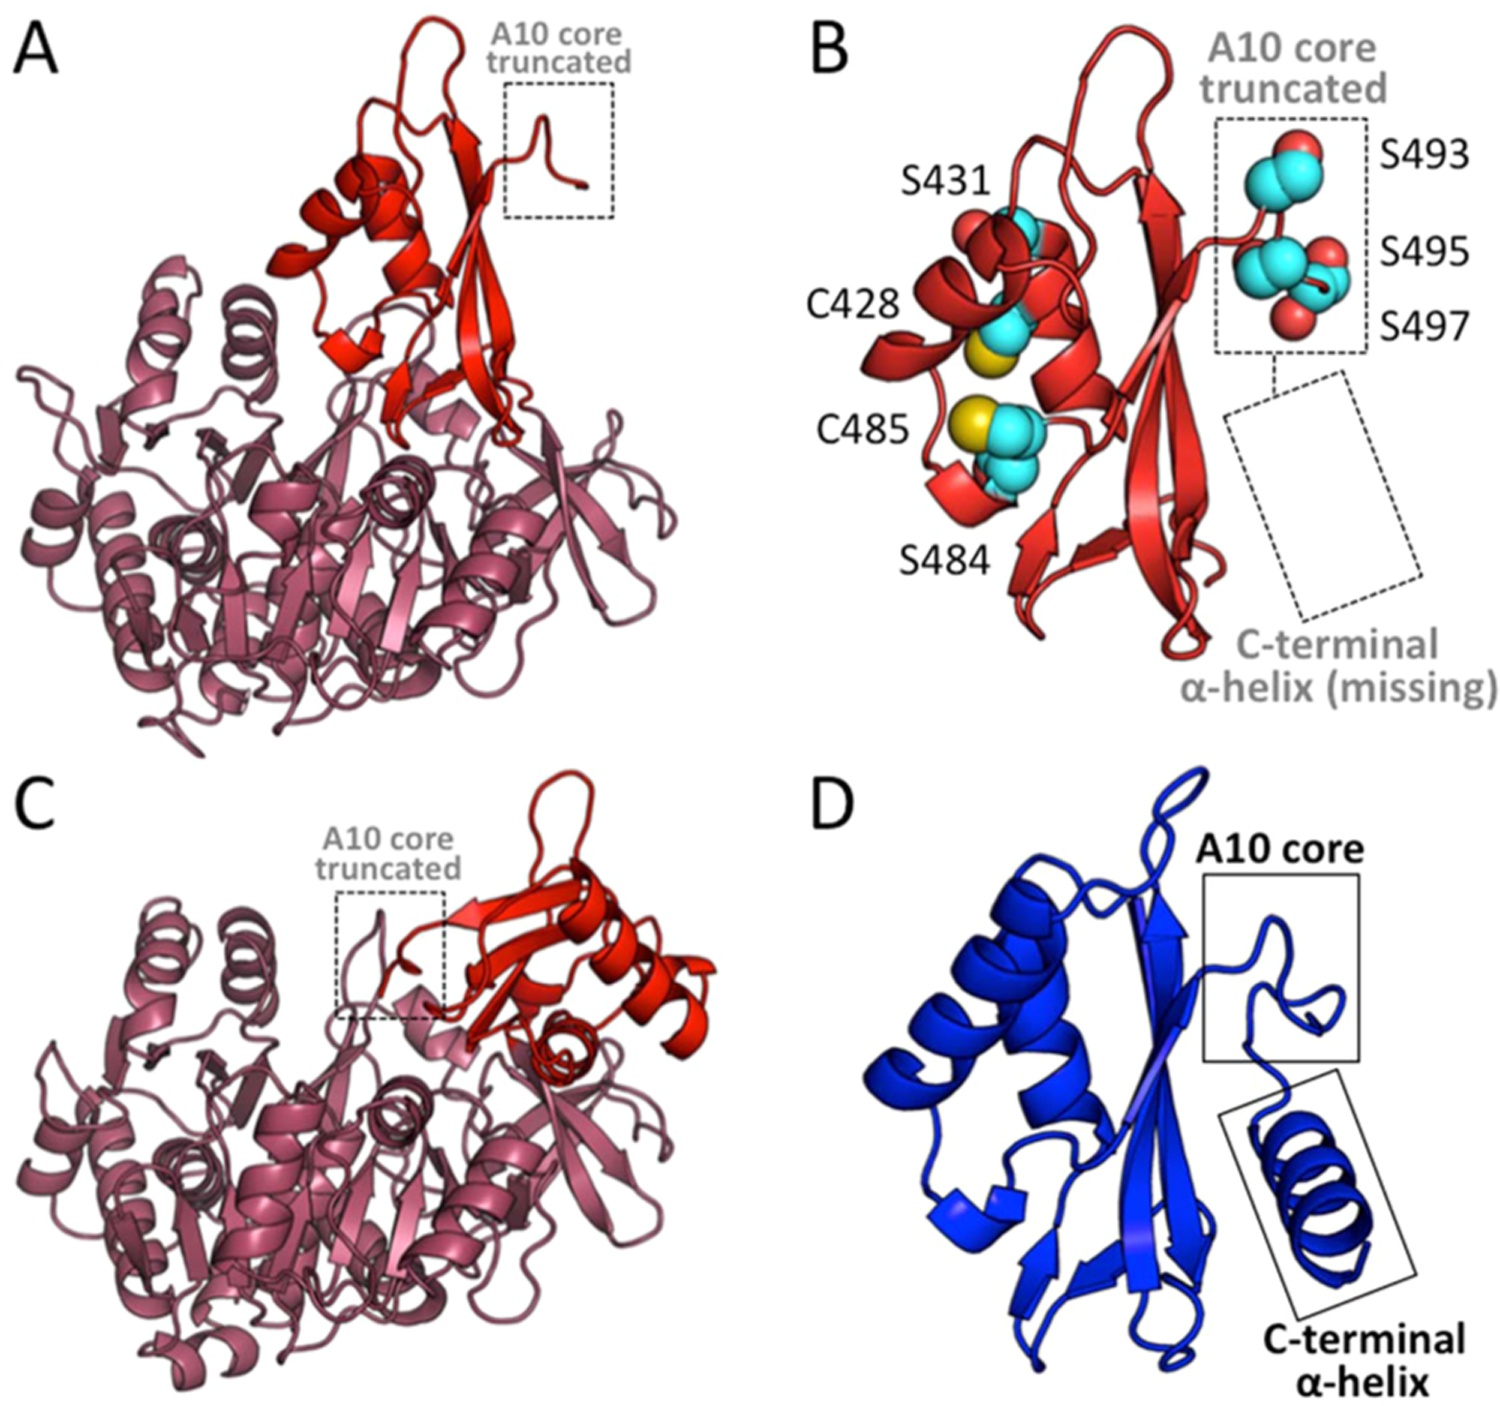
Figure 4.

AuaE homology model in both conformation 1 and conformation 2, and a comparison of the C-terminal domains of AuaEII and AuaE. (A) Cartoon representation of an AuaE homology model generated using the structure of benzoate:CoA ligase (PDB ID: 4EAT) with the C-terminal domain (colored in red) in conformation 1 (adenylate forming conformation). The truncated A10 core is labeled and located away from the N-terminal (colored in raspberry) active site. (B) Close up view of the C-terminal domain of the AuaE homology model in conformation 1, showing the truncated A10 core and missing C-terminal helix. Residues (serines and cysteines) that may be involved in acyltransfer are represented in spheres. (C) Cartoon representation of the AuaE homology model generated using the structure of benzoate:CoA ligase (PDB ID: 2V7B) with the C-terminal domain (colored in red) in conformation 2 (thioester forming conformation). (D) The C-terminal domain of AuaEII displaying the conserved A10 core and C-terminal helix.
