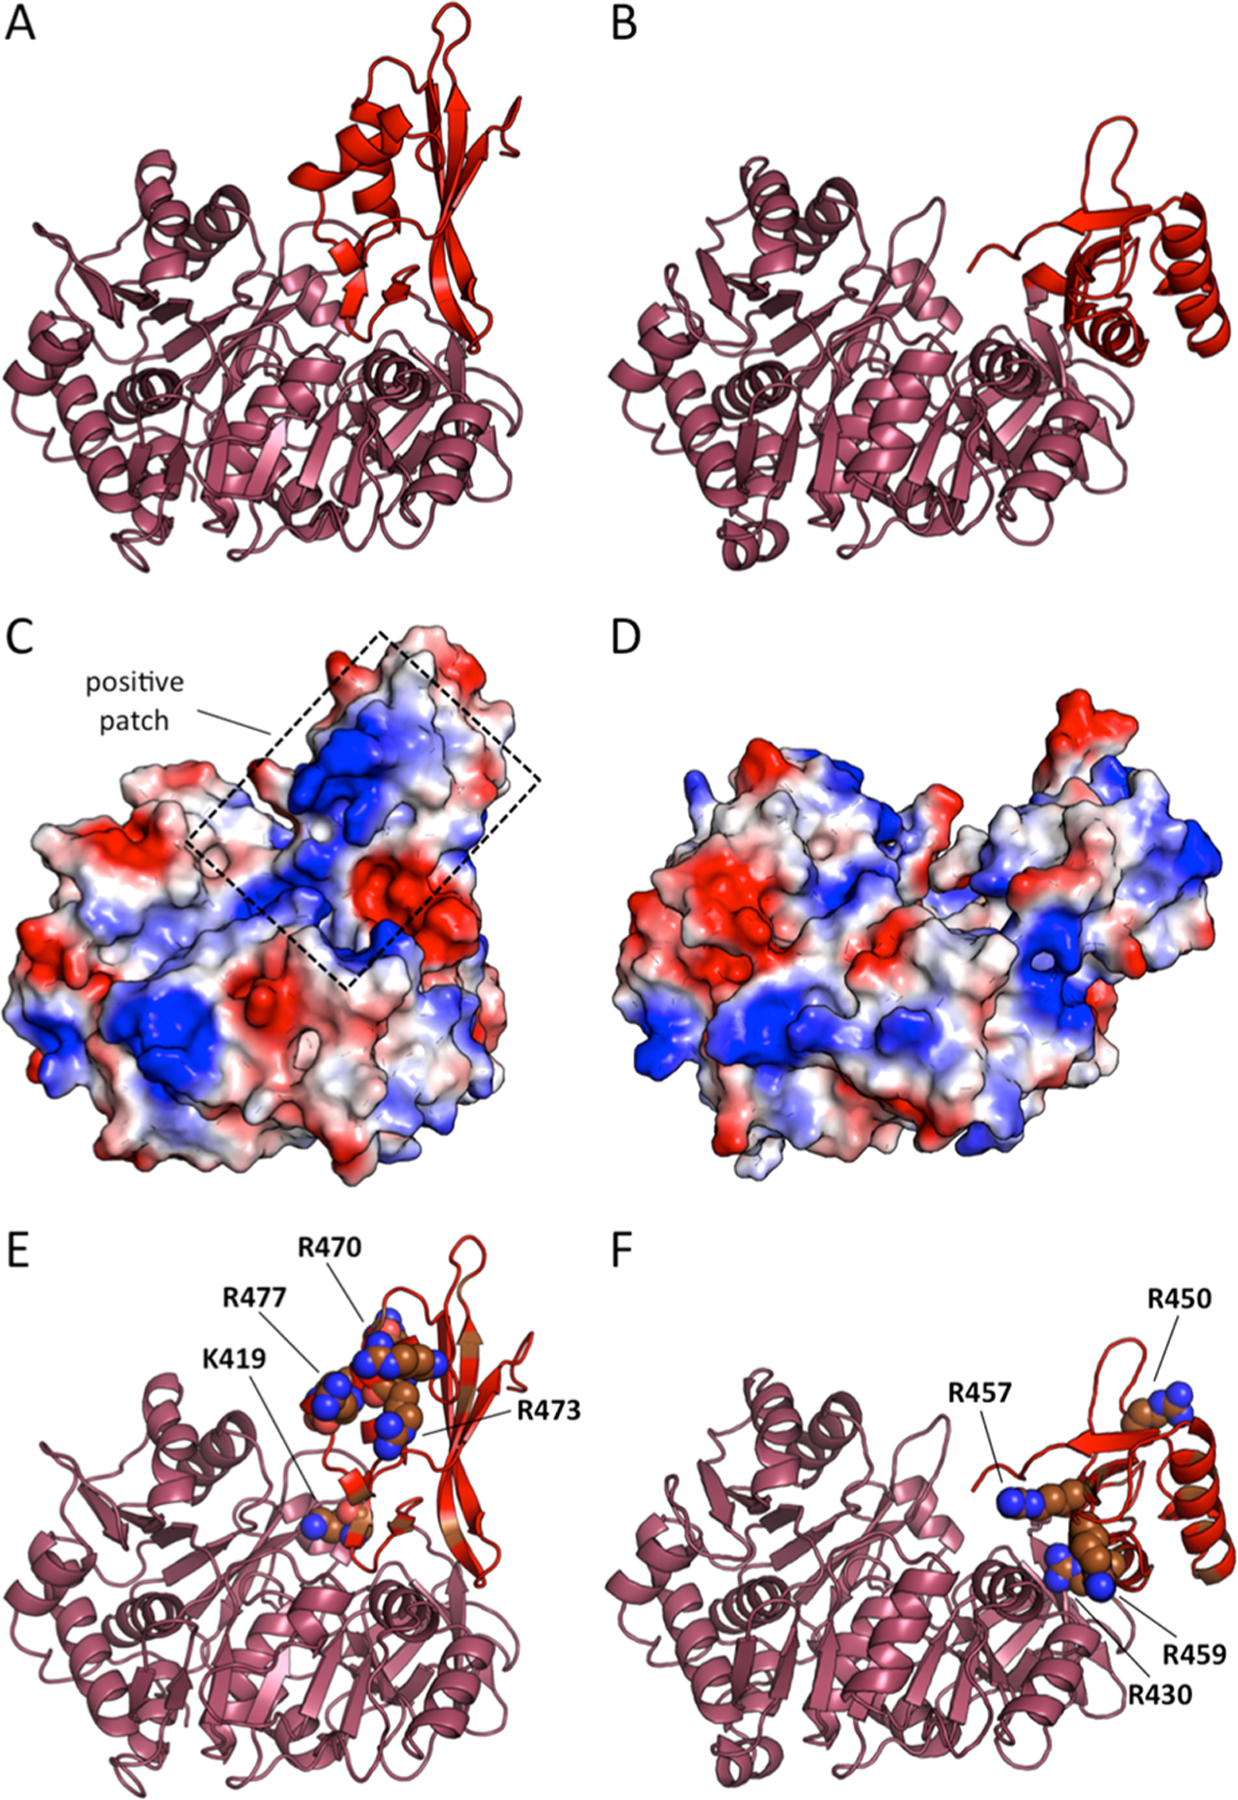
Figure 5.

AuaE homology models in conformations 1 and 2 with electrostatic surface analysis. (A) AuaE model of conformation 2. (B) AuaE model of conformation 1. (C) AuaE conformation 2 electrostatic surface*. (D) AuaE conformation 1 electrostatic surface*. (E) Positively charged residues facing the N-terminal of AuaE in conformation 2. (F) Positively charged residues facing the N-terminal of AuaE in conformation 1. *Red represents negative and blue is positive surface charge.
