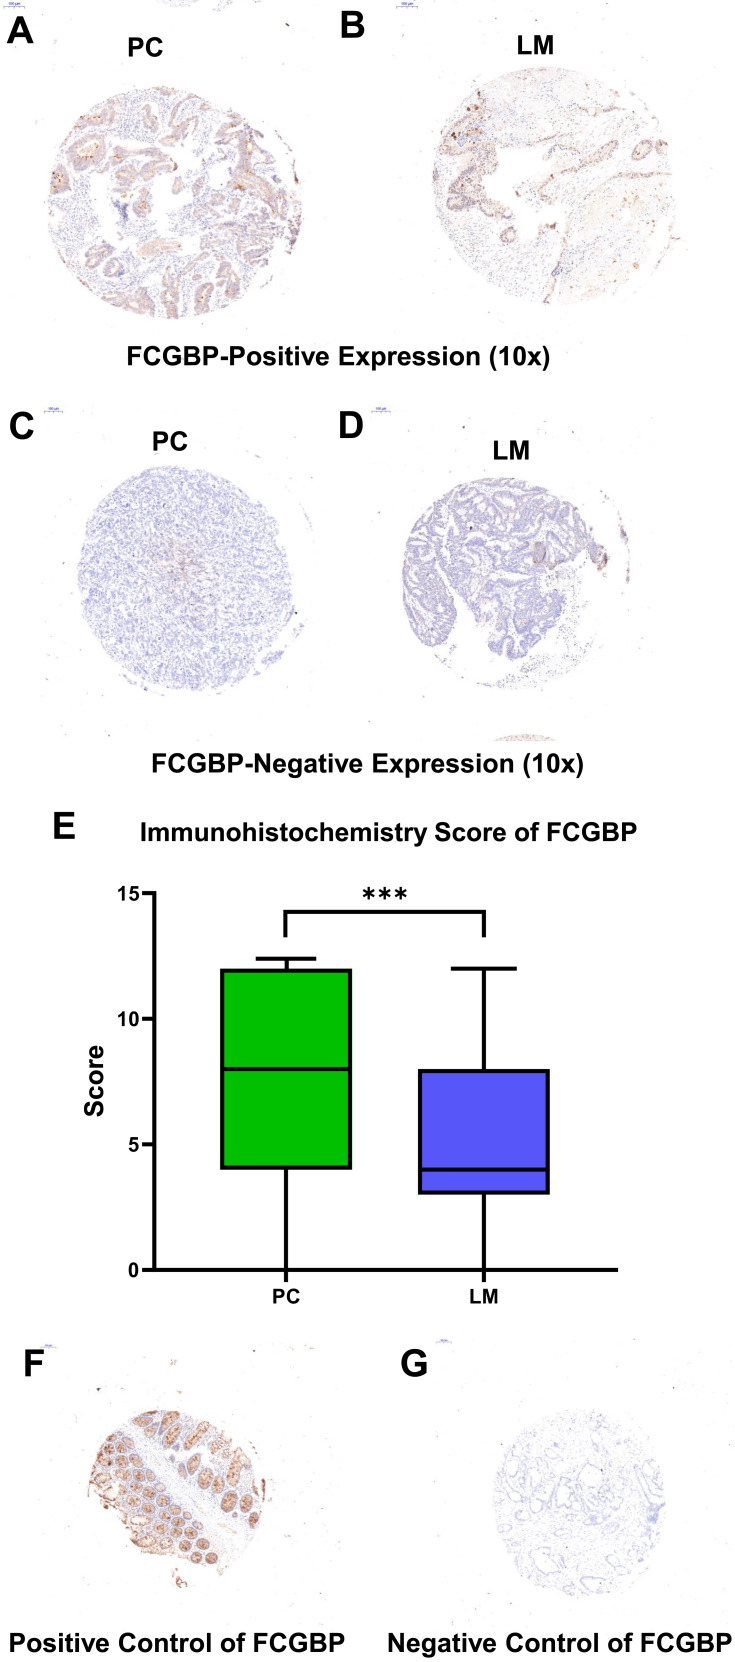
Figure 1.
Representative immunohistochemistry staining pictures of FCGBP. High expression in CRC tissue and liver metastatic tissue (10× for A, B, SI=10) and low expression (10× for C, D, SI=1) for FCGBP protein are shown. (E) The immunohistochemistry score of FCGBP protein in PC and LM, ***p<0.001. (F, G) Positive and negative controls for FCGBP immunohistochemistry.

