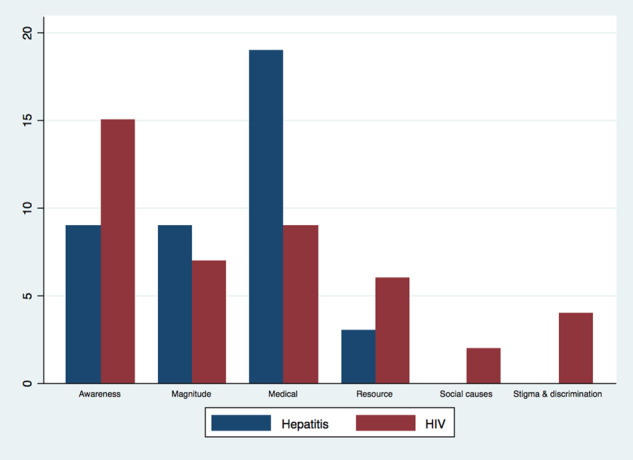
HIV and viral hepatitis articles by main frames (%). Note: The percentage of articles is calculated by dividing the number of articles appearing in each frame for viral hepatitis and HIV by the respectivenumber of sampled articles for each disease (N = 137 for HIV; N = 117 for hepatitis). Time frame: 1 January 2006 to 30 September 2016
