Figure 2.

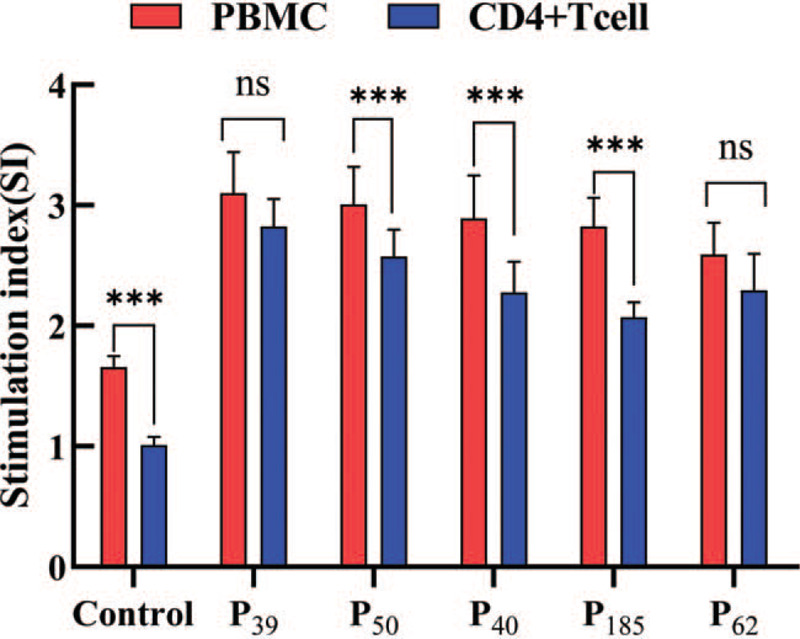
Comparison of CD4+T cell proliferation and peripheral blood lymphocytes proliferation. Notes:∗P < .05 vs Control group, ∗∗P < .01 vs Control group, ∗∗∗P < .001 vs Control group. nsP > .05 vs Control group.

Comparison of CD4+T cell proliferation and peripheral blood lymphocytes proliferation. Notes:∗P < .05 vs Control group, ∗∗P < .01 vs Control group, ∗∗∗P < .001 vs Control group. nsP > .05 vs Control group.