
Figure 3.
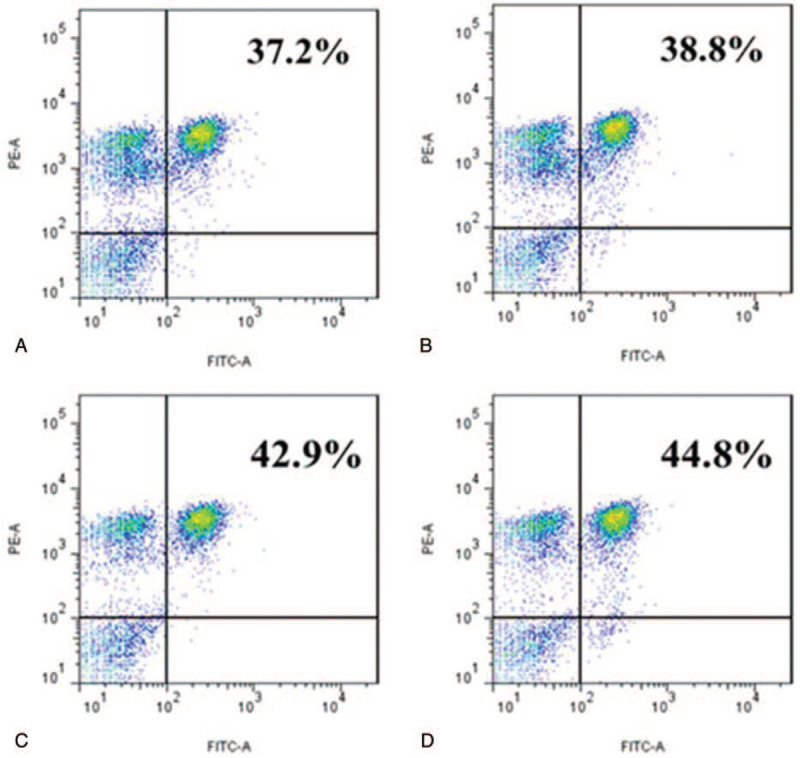
Phenotype analysis of the lymphocytes stimulated by CD4+T cell epitope peptides. Notes: The negative control (Fig. 3A 3Aof the proliferation assay. (The mean of 3 separate experiments is 36.40% ± 0.91%); the percent of CD4+T cells after stimulation by P39 (Fig. 3B), P62 (Fig. 3C), and P39 + P62 (Fig. 3D). (The mean of 3 separate experiments is 38.17% ± 1.00%, 41.96% ± 1.66%, and 44.57% ± 1.18% respectively); B, C, D vs A: P < .05Values represent mean ± SD from 3 independent experiments. This figure illustrates 1 of the 3 independent experiments.