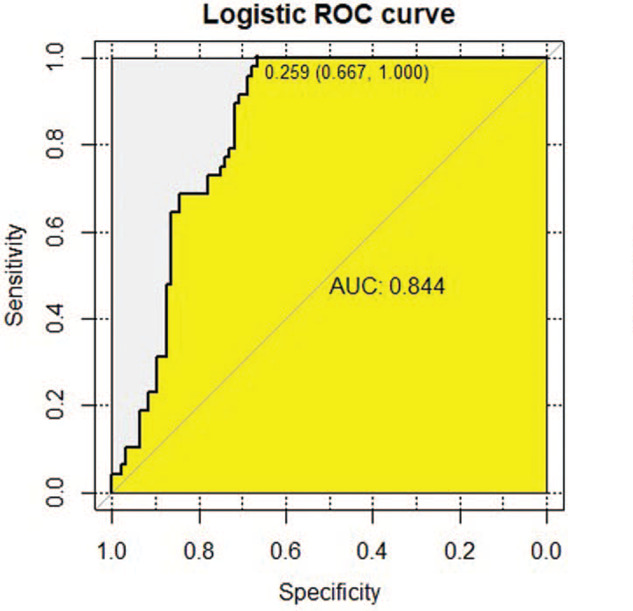
Figure 4.

The receiver operating characteristic (ROC) curve analysis of immunoglobulin G antibody response for the Candidate Peptide P39. Notes: ROC, receiver operating characteristics; area under the curve (AUC) Diagnostic basis of ROC curve: When the area of the curve was between 0.5 to 1, the closer to 1, that is, the larger the area, the higher the diagnostic accuracy would be. When 0.5 < AUC≤0.7, there is a lower accuracy; When 0.7 < AUC≤0.9, there is a certain accuracy; When the AUC > 0.9, the diagnosis has a higher accuracy. The sensitivity of P39 was 75%, the specificity was 67.71%, the Yoden Index was 0.667, the cut-off value was 0.259, and the AUC value was 0.844.
