
Table 4.
Cox Regression analysis for patients with Crohn's disease
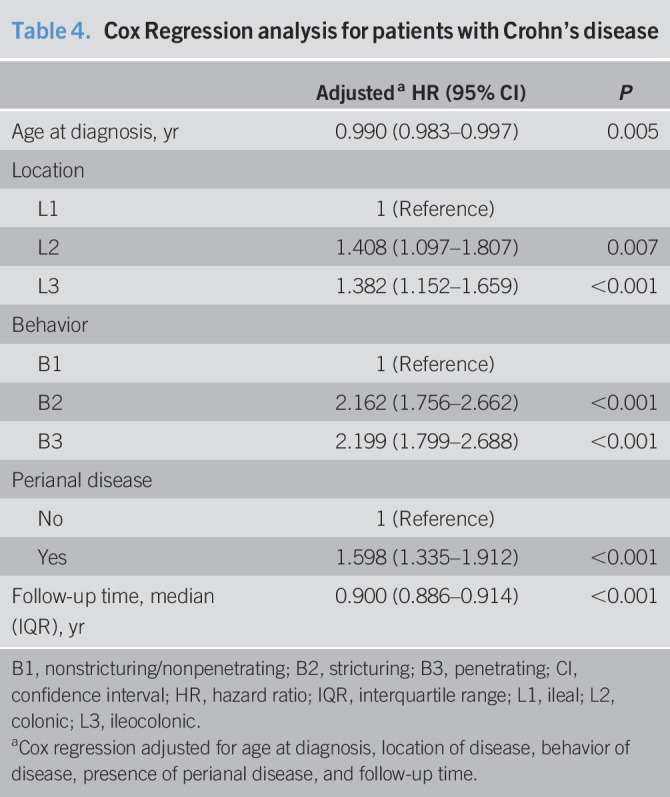
| Adjusteda HR (95% CI) | P | |
| Age at diagnosis, yr | 0.990 (0.983–0.997) | 0.005 |
| Location | ||
| L1 | 1 (Reference) | |
| L2 | 1.408 (1.097–1.807) | 0.007 |
| L3 | 1.382 (1.152–1.659) | <0.001 |
| Behavior | ||
| B1 | 1 (Reference) | |
| B2 | 2.162 (1.756–2.662) | <0.001 |
| B3 | 2.199 (1.799–2.688) | <0.001 |
| Perianal disease | ||
| No | 1 (Reference) | |
| Yes | 1.598 (1.335–1.912) | <0.001 |
| Follow-up time, median (IQR), yr | 0.900 (0.886–0.914) | <0.001 |
B1, nonstricturing/nonpenetrating; B2, stricturing; B3, penetrating; CI, confidence interval; HR, hazard ratio; IQR, interquartile range; L1, ileal; L2, colonic; L3, ileocolonic.
a
Cox regression adjusted for age at diagnosis, location of disease, behavior of disease, presence of perianal disease, and follow-up time.