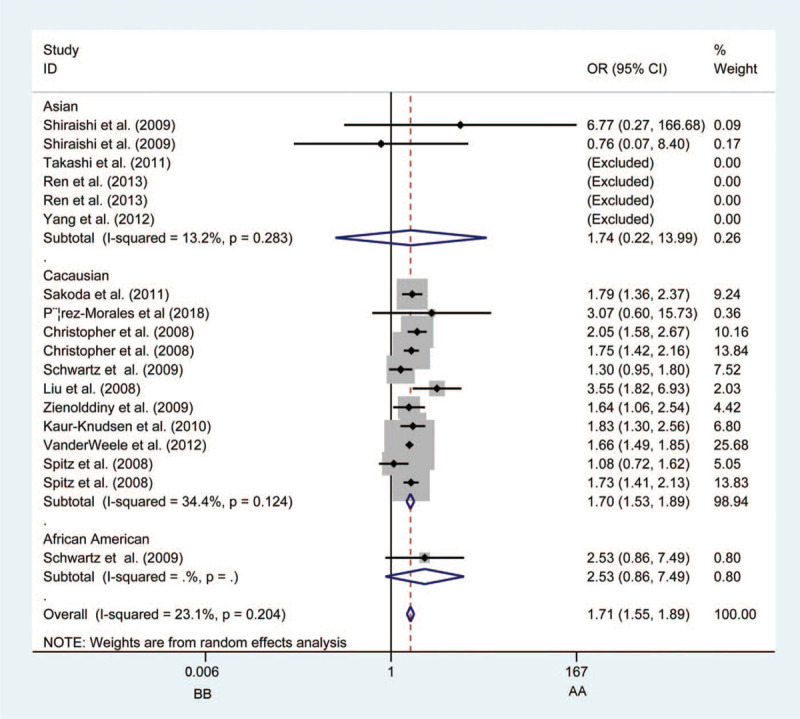
Figure 1.

Forest plots of the association between CHRNA3 rs1051730 polymorphism and the risk of lung cancer in Caucasian population (BB vs AA). Each square indicates a study, and the area of squares is proportional to the weight of the study. The diamond represents the summary odds ratio and 95% confidence interval. CI = confidence interval, OR = odds ratio.
