
Figure 6.
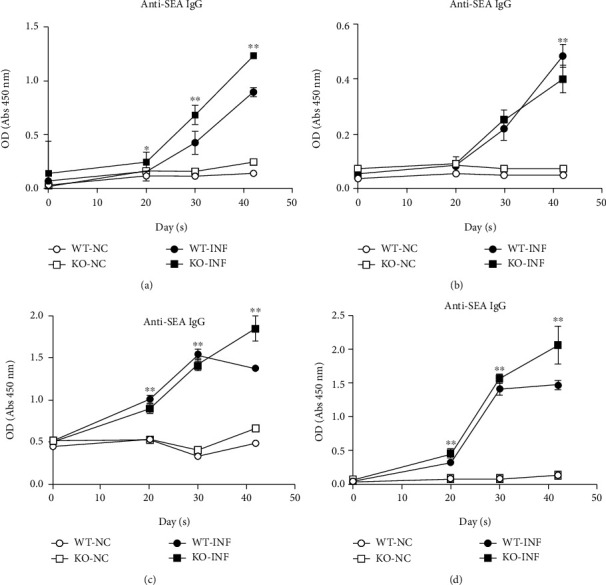
Specific antibody responses in USP21fl/flFOXP3Cre mice infected with S. japonicum. (a–d) Serum collected from the WT and KO mice in the NC and INF groups (n = 26 ± 2/group) at different stages of the infection (uninfected, day 20, day 30, day 42). (a) Comparison of the changes in the anti-SEA IgG content. The data are presented as the means ± SD. For the comparison between infection groups, ∗p = 0.01 on day 20, ∗∗p < 0.001 on day 30, and∗∗p < 0.001 on day 42. (b) Comparison of the anti-SEA IgM content. The data are presented as the means ± SD, and ∗∗p = 0.002 on day 42 when comparing between the infection groups. (c) Comparison of the anti-SWAP IgG contents. The data are presented as the means ± SD; for the comparison between infection groups, ∗∗p < 0.001 on day 20, ∗∗p = 0.003 on day 30, and ∗∗p < 0.001 on day 42. (d) Comparison of the anti-SWAP IgM contents. The data are presented as the means ± SD. For the comparison between infection groups, ∗∗p < 0.001 on day 20, ∗∗p = 0.004 on day 30, and ∗∗p < 0.001 on day 42.