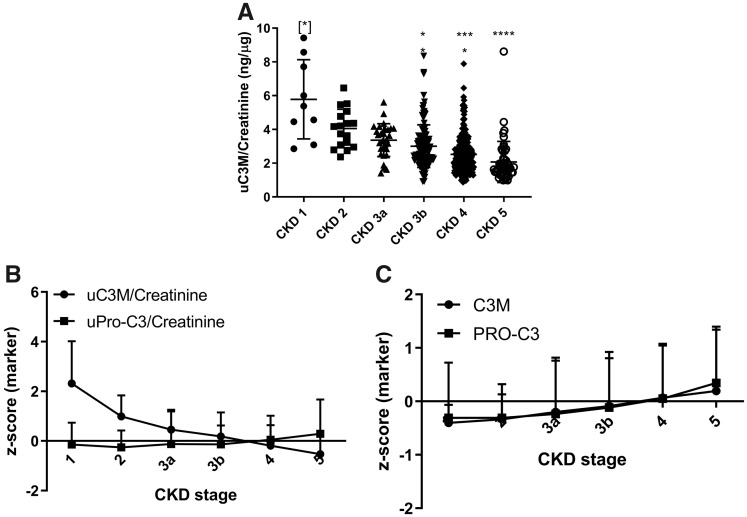
FIGURE 2.
Levels of the markers at different CKD stages. (A) uC3M/creatinine at different CKD stages. (B) Z-score of the urinary markers at different CKD stages. (C) Z-score of the serum markers at different CKD stages. Statistical significance: *P < 0.05; ***P < 0.001; ****P < 0.0001. (A) Data are presented as a scatter plot, (B) and (C) data are reported as mean and SD.

