FIGURE 3.

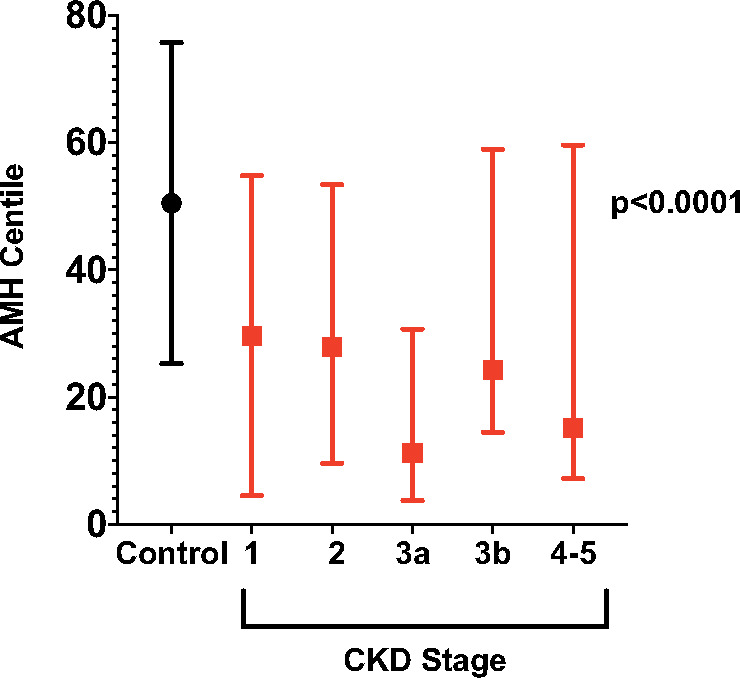
AMH centiles in women without CKD (control) and in women with CKD Stages 1–5. Bars show the median (IQR) centile value. P < 0.0001 is a measure of the difference in the distribution of AMH centile across all groups shown.

AMH centiles in women without CKD (control) and in women with CKD Stages 1–5. Bars show the median (IQR) centile value. P < 0.0001 is a measure of the difference in the distribution of AMH centile across all groups shown.