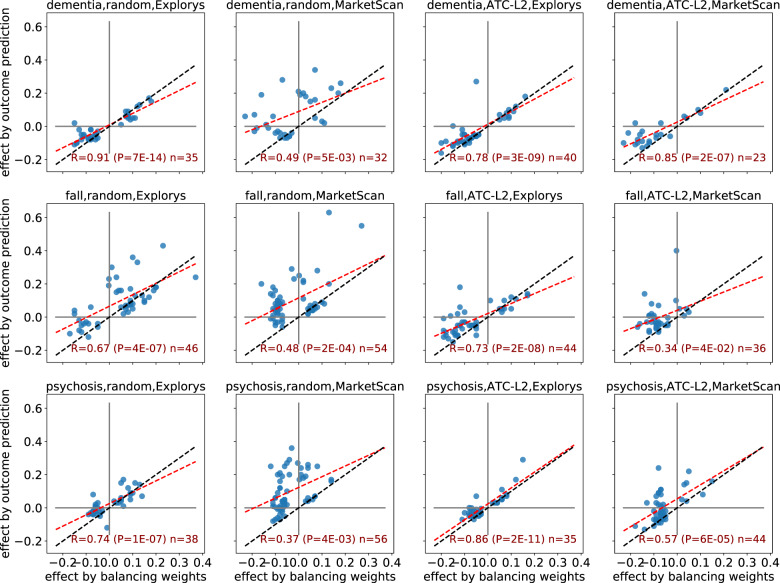
Figure 3.
A comparison of estimated effects: balancing weights vs. outcome prediction. Each chart shows a different setting of the trial with respect to the outcome (dementia, fall, and psychosis; rows), control cohort (random and ATC-L2; left and right columns), and database (Explorys and MarketScan; alternate columns). Each point corresponds to a drug whose estimated effect was significant at FDR 5% by at least one of the two compared methods. The red line is the fitted least squares regression line; blue line indicates y = x.

