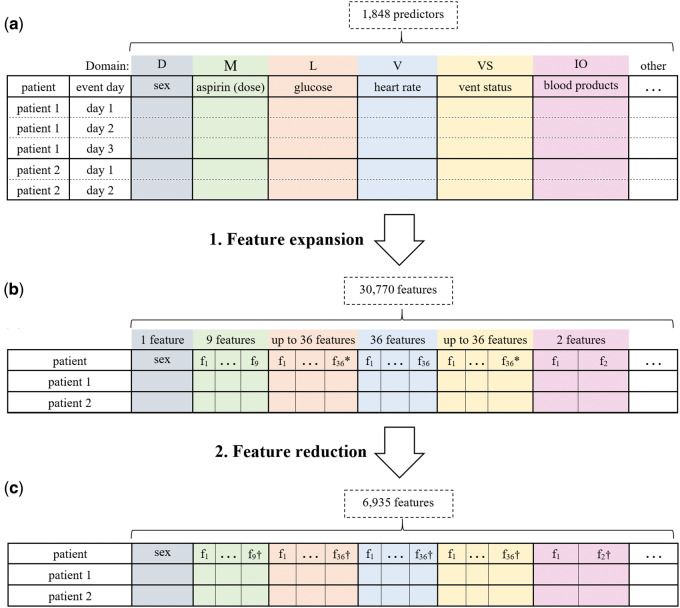
Figure 1.
Steps in preparing the predictor variables. (A) The predictor variables for two example patients as measurements with one row per day are presented. The colors represent data domains; D: demographics, M: medication administrations, L: laboratory test results, V: vital signs, VS: ventilator settings, IO: input/output, and other: other domains. (B) The result of expanding the temporal predictor variables (total = 1848) to features (total = 30 770) is shown. This step flattens the data so that a patient that is represented by multiple rows is now represented by a single row. * denotes that the number of expanded predictors differs depending on the predictor value type (eg, nominal or continuous). (C) The features after feature reduction are shown, in which the number of features is reduced to 6935 features. † indicates that the number of features may be different for each variable in the domain.

