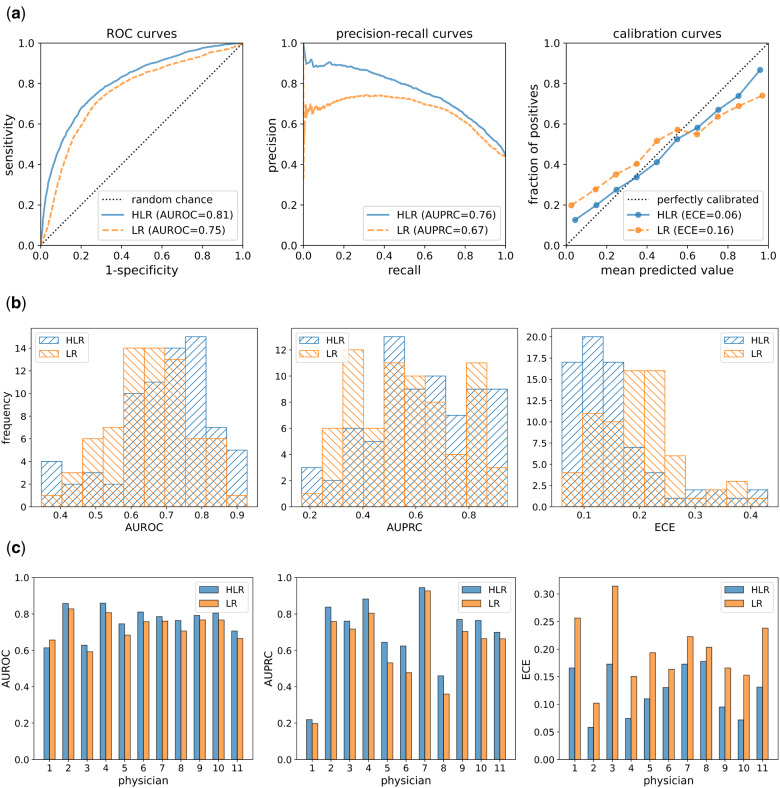
Figure 4.
(A) ROC, precision-recall, and calibration curves over all 73 target variables across all physicians. For the calibration curves, the closer a curve is located to the dotted diagonal line, the more calibrated the corresponding approach is. (B) Distribution of AUROC, AUPRC, and ECE values for 73 models. Forward-slash hatches in blue represent the distributions for HLR models and backslash hatches in orange denote the distributions for LR models. The AUROC and AUPRC distributions for HLR models are right-skewed relative to the LR models, which show that HLR models generally have better discrimination power. The distribution of ECE values of HLR models is left-skewed relative to the LR models, which means that HLR models are generally better calibrated than LR models. (C) AUROC, AUPRC, and ECE values for each physician reviewer over all 73 models. The values for HLR models are shown in blue and the values for LR models are shown in orange. The AUROC and AUPRC values are higher for HLR models than for LR models, except for the AUROC value for physician 1. All the ECE values are lower for HLR models, which means that HLR models are better calibrated than the LR models.

