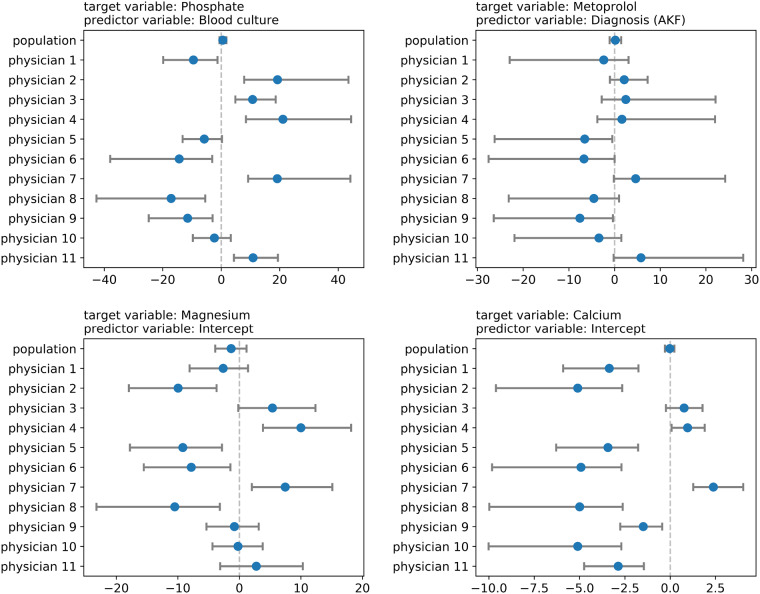
Figure 5.
Examples of variation among physicians as seen from the values of the coefficients of a specific predictor variable. Each panel shows estimates of the coefficients of a predictor variable in an HLR model. A circle denotes the median value and the bar denotes the 80% credible interval for the posterior distribution of the model parameter.

