
FIGURE 2:
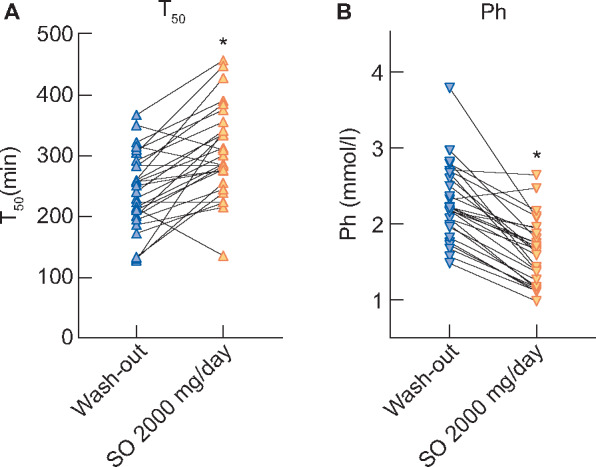
Effects of SO therapy on (A) T50and (B) serum phosphateon an individual patient level between washout and SO 2000 mg/day. Asterisks indicate statistically significant differences (all P < 0.0001) between SO 2000 mg/day and the preceding washout phase.
Δ: mean change between washout and SO 2000 mg/day.