FIGURE 2.

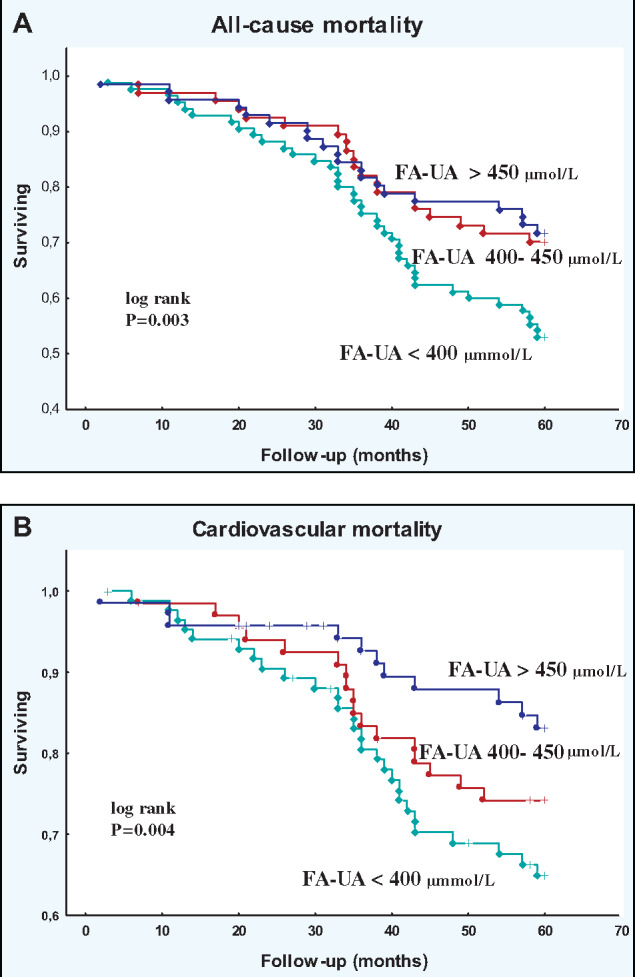
Kaplan–Meier survival curves for all follow-up study patients according to low, intermediate and high FA-UA groups: (A) all-cause and (B) CV mortality.

Kaplan–Meier survival curves for all follow-up study patients according to low, intermediate and high FA-UA groups: (A) all-cause and (B) CV mortality.