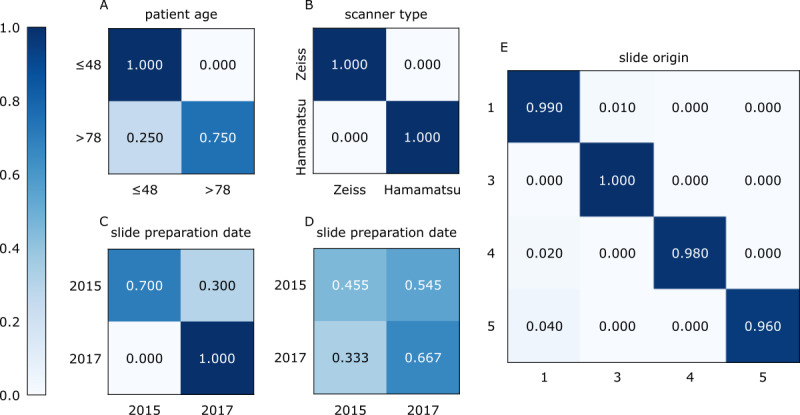
Figure 2.

Distributions of the models’ predictions for tasks 1 to 4 on slide level for ResNet50 (run 1). (A) Task 1 (patient age) prediction. (B) Task 4 (scanner type) prediction. (C, D) Comparison of the two most distinct classification subtasks for task 2 (slide preparation date), where balanced accuracy was either at a maximum (C: data set 2, 2015 versus 2017) or at a minimum (D: data set 1, 2015 versus 2017). (E) Task 3 (slide origin) prediction, with the data set number displayed rather than the data set origin for better readability.
