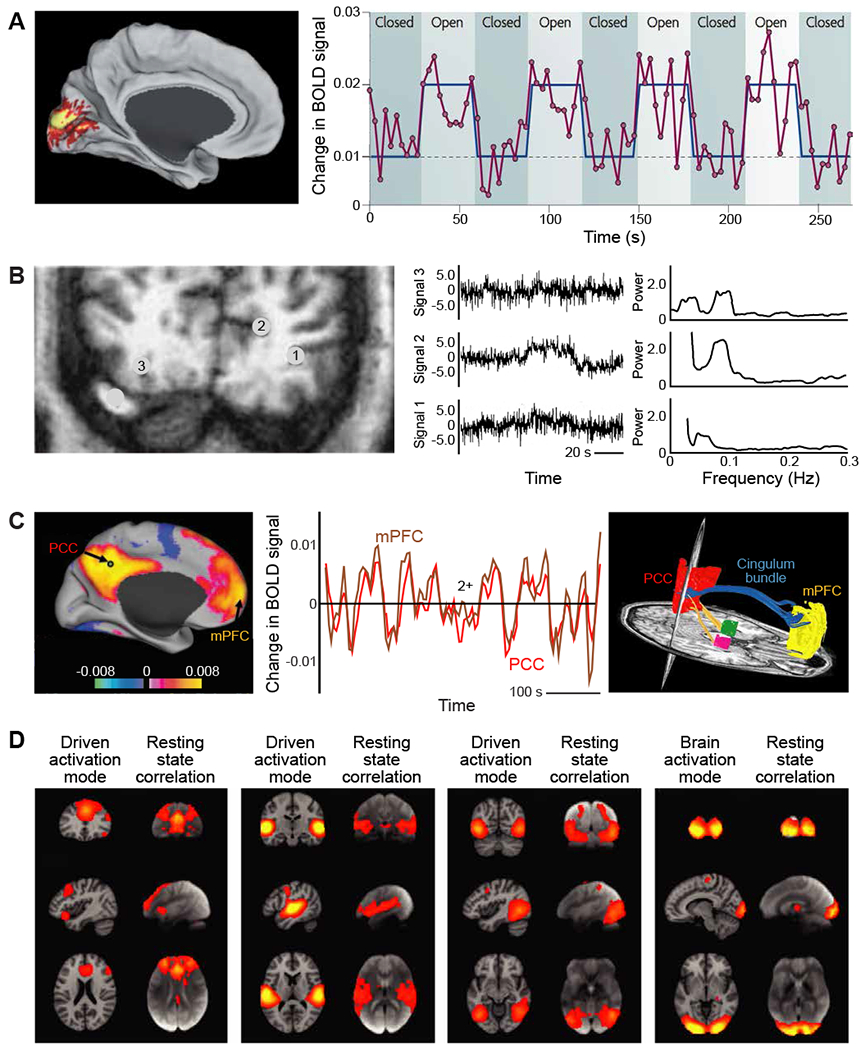
Figure 2. Functional MRI (fMRI) uses correlation in the fluctuations of signal strength to infer brain regions that are directly connected.

(A) Changes in the basic blood oxygenation level dependent (BOLD) fMRI signals generated in human visual cortex in response to changes in luminance in a full field visual input. Unaveraged BOLD signal (magenta) was obtained from a region in the primary visual cortex during a task that required subjects to open and close their eyes. The task is shown in blue, and the times are delayed to account for the hemodynamic response. The subtraction of the eyes-closed condition from the eyes-open condition identifies a BOLD signal intensity difference in the primary visual cortex (shown on the right). Note the variability as well as the average increase in signal amplitude upon stimulation. From (Fox and Raichle, 2007).
(B) Blood oxygenation level dependent fMRI signals were obtained from a coronal slice, 2.8 cm from the occipital pole (left). Three unprocessed time courses of the BOLD fMRI signal of representative voxels, numbers 1-3 and located outside of visual cortex, and their corresponding frequency spectra (right). A binocular visual stimulus, provided by a pair of flickering red LED patterns, was on during the 40 - 70 s time interval of the 110 s period and drives voxel 4; data not reproduced here. From (Mitra et al., 1997).
(C) The BOLD fMRI signals recorded from two distant regions in human cortex, the posterior cingulate / precuneus cortex (PCC) and the medial prefrontal cortex (mPFC), are highly correlated on the time scale of tens to hundreds of seconds. Correlations are calculated between a seed voxel in the PCC and all other voxels in the brain for a single subject during rest. The spatial distribution of correlation coefficients shows both positive and negative values and was thresholded at R2 = 0.1 (left image). The time course for a single run is shown for the seed region (PCC) and a region (mPFC) positively correlated with this seed region. The functional connection between the PCC and the mPFC is consistent with a fiber track revealed by diffusion tensor imaging (blue trace in right image). Left and center panels from (Fox et al., 2005), right panel from (Greicius et al., 2009).
(D) Four well-matched pairs of resting-state subnetworks that show a close correspondence between the independent analyses of activated (left column) and resting-state (right columns) brain dynamics. Activation data is from the 20-component analysis of the 29,671-subject BrainMap activation database (Fox and Lancaster, 2002; Laird et al., 2005) and resting-state data is from a separate analysis of a 36-subject resting-state fMRI dataset (Smith et al., 2009). Shown are the three most informative orthogonal slices for each pair. Left columns: network from BrainMap, shown superimposed on the MNI152 standard space template image. Right columns: resting-state fMRI data, shown superimposed on the mean fMRI image from all subjects. From (Smith et al., 2009).
