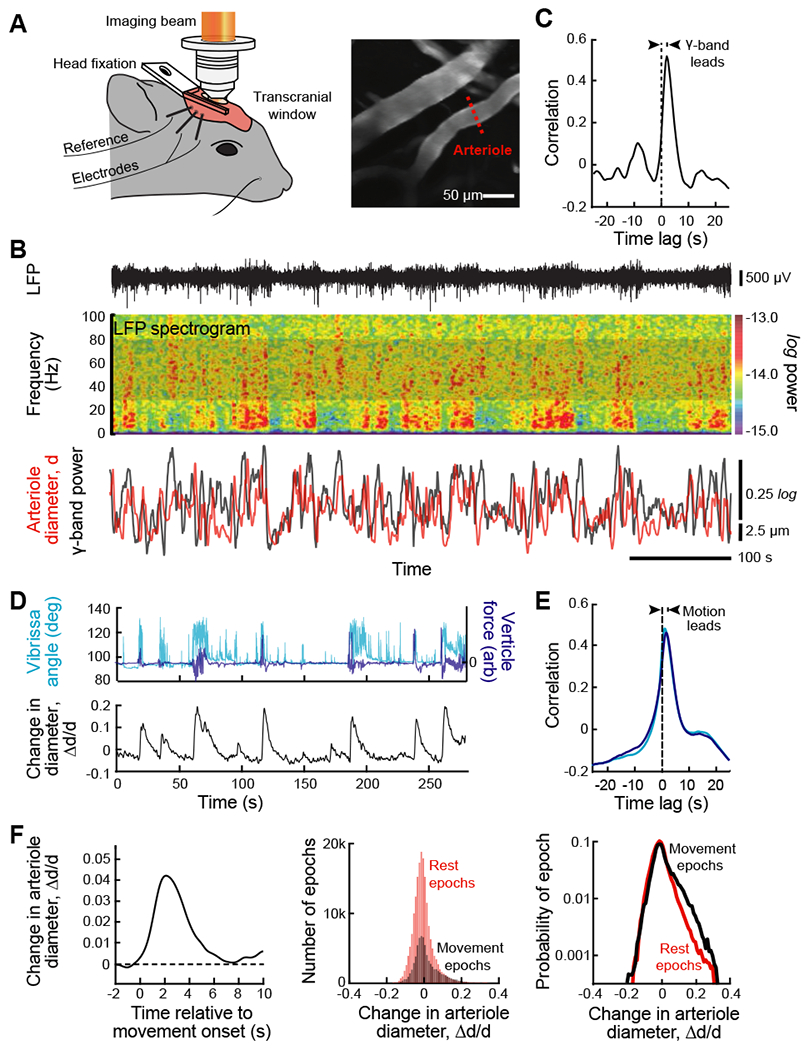
Figure 6. The envelope of neuronal γ-band oscillations locks to and leads vasomotor oscillations in arteriole diameter.

(A) Set-up with a head-fixed awake but resting mouse for two-photon imaging of arteriole diameter along with measurement of the LFP (left panel). A thinned skull window was used to preserve vasomotion (Drew et al., 2010). Two-photon images of surface vessels and scan path to define lumen diameter (center panel). From (Mateo et al., 2017).
(B) Example data showing the LFP (top trace), the spectrogram of the LFP with a window of 2.0 s and a bandwidth of 2.5 Hz, and the time series of the integrated γ-band power and diameter for one arteriole in the field (bottom traces). From (Mateo et al., 2017).
(C) The cross correlation of the two time series used for the example of panel B, 600 s total time, show that the LFP leads the diameter change. As an average across animals, movement proceeds the vasodilation by 1.9 ± 0.2 s (82 vessels from 27 mice with 600 s of data per vessel). From (Mateo et al., 2017).
(D) New data on the recording of self-generated, i.e., spontaneous movement in a head-fixed awake but resting mouse, obtained concurrent with two-photon imaging of arteriole diameter (Winder et al., 2017) similar to that in panel A, to determine the possible contribution of such movement to the entrainment of vasomotion. Bouts of whisking were determined with videography and whole-body vertical acceleration determined with a force sensor attached to the tube supporting the mouse’s body.
(E) Correlation analysis of new data (27 vessels from 9 mice with 1700 to 12000 s of data per vessel). The time-lag of the correlation shows that movement leads the change in diameter (bottom panel) with lag times similar to that for movement proceeds the vasodilation by 1.8 ± 0.3 s for whisking and 1.5 ± 0.3 s for whole body motion.
(F) A re-analysis of the data of Mateo et al. (2017), similar to that for the new data of panels E and F, using previously unpublished simultaneous measurements of the whole body horizontal acceleration acquired during imaging (82 vessels from 27 mice). Accelerations lead to a change in arteriole diameters (left panel); the threshold detectability was ~ 0.01 g. Theses movement related changes in diameter are compared to rest events (middle panel) and dominate the largest changes in diameter (right panel).
