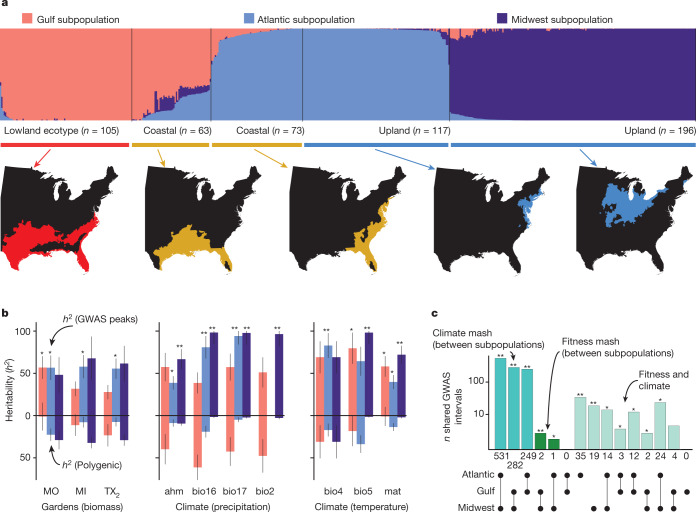
Fig. 3. Population and quantitative genomics of climate-associated adaptation.
a, Admixture proportions among three gene pools (coloured by subpopulation) and three ecotypes (labelled below), calculated using eigenvector decomposition of the identity-by-descent matrix. The corresponding geographical distribution of each ecotype is presented below the bar plot (coloured by the ecotype distributions from Fig. 1a). Publicly available cultural and physical GIS layers were accessed with the rnaturalearthdata R package51. b, Post hoc tests of SNP–heritability (mean h2 ± s.e.m.) attributable to polygenic background (below the black horizontal lines) and significant multivariate adaptive shrinkage GWAS hits (above the black horizontal lines) are presented for the three main sites (biomass) and for precipitation- and temperature-related climate variables, and coloured by subpopulations (following a). Extended Data Fig. 2c provides descriptions of the climate variables (ahm, bio2, bio4, bio5, bio16, bio17 and mat). Statistical significance of higher heritability for GWAS hits relative to polygenic inheritance is indicated for two-sided Z-score P values; **P < 0.001, *P < 0.05. c, There are large and significant overlaps in climate-associated multivariate adaptive shrinkage (mash) intervals between subpopulations, and smaller but significant overlaps between fitness and climate hits in the Atlantic and Midwest subpopulations. Two-sided Fisher’s test P value significance, following b.

