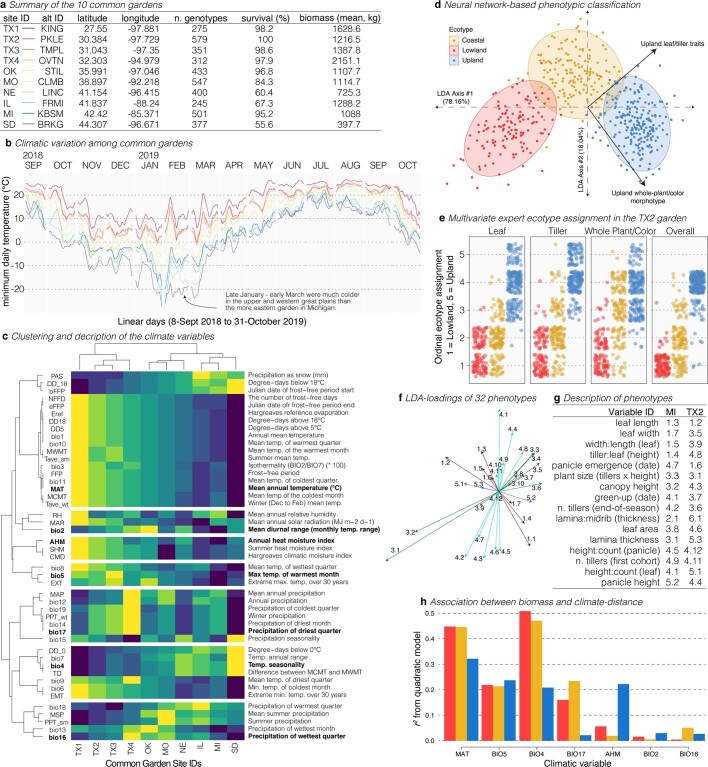
Extended Data Fig. 2. Phenotypic and climatic gradients among common gardens and ecotypes.
a, The ten common gardens span much of the geographical distribution of, and elicit very different phenotypic responses among, our switchgrass diversity panel. For each garden, we present the georeferenced location and some basic quantitative genetic attributes of the plants grown there. b, To illustrate the climate context of winter mortality, we present a seven-day rolling mean of minimum daily temperature across the study period. Line colours match the colour key in a. c, To investigate the climatic attributes of each garden, we clustered 46 climatic variables from WorldClim (variables are named bio1–1922) and ClimateNA21 using the georeferenced locations for the diversity panel; the identifiers (left) and description (right) accompany each row. These seven clusters, separated by breaks in the heat map, are represented by the seven climate variables that most closely correlated with the first principal component eigenvector of each cluster (labelled in bold). d, To investigate ecotype evolution, we probabilistically assigned each member of the diversity panel to one of three ecotypes (nupland = 221, ncoastal = 157, nlowland = 129) using a set of morphological (n = 16 at 2 gardens) and qualitative (n = 2) phenotypes; the linear discriminant functions that distinguish the ecotypes are presented here along with the eigenvectors of the two qualitative ecotype categorizations. Each point represents a single genotype grown in both TX2 and MI gardens (n = 509). LDA, linear discriminant analysis. e, Qualitative ecotype assessments from experts are presented for the TX2 garden in 2019. The y-axis scale is ordinal with five categories, but points are jittered so that the density of observations is more obvious. Points are coloured by neural network classification following d. f, Loadings for the other 16 variables (across 2 gardens) are plotted on the same scale and axes as d. To distinguish variables, we clustered each into one of four groups, representing variation in leaf (dark green) (3), whole plant (red) (1) and combinations of these. g, The table presents a legend for the labels in f, in which each variable was measured in both MI and TX2 gardens. More detailed descriptions of the phenotypes can be found in Supplementary Data 5. h, For each of the seven climate variables, we corrected climate distance between the collection site and each common garden. The quadratic model fit (r2) for each variable and ecotype are presented.

