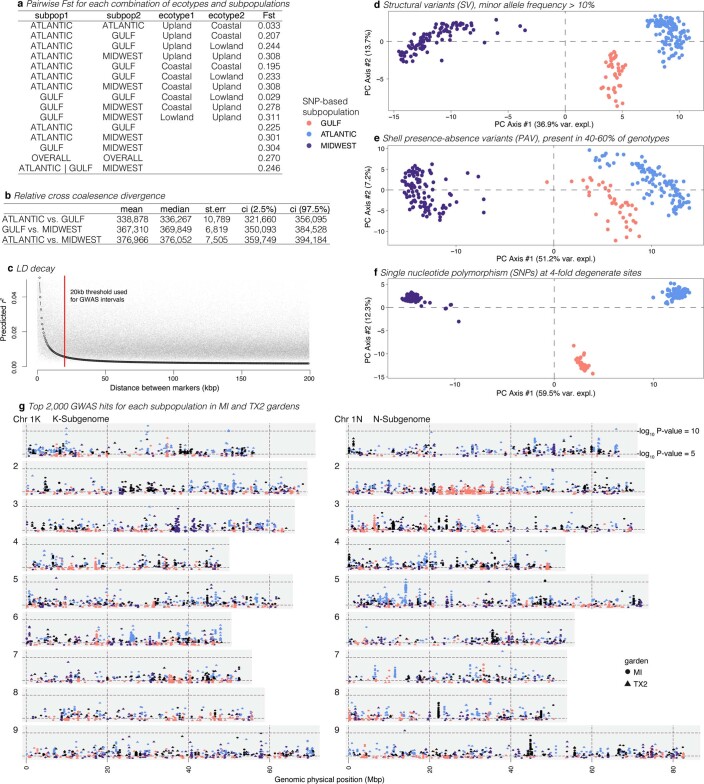
Extended Data Fig. 3. Population and quantitative genetic divergence between and evolution within subpopulations and ecotypes.
a, Pairwise F-statistics between each subpopulation-by-ecotype combination and across all ecotypes for each subpopulation. b, Cross coalescence (RCCR) represents an alternative method to define divergence. Here, 16 bootstraps of RCCR profiles were converted to generation time at which divergence occurred. Statistics across the bootstraps are presented. c, Linkage-disequilibrium nonlinear function of physical distance and predicted correlation coefficients among markers for the entire sample. The linear model prediction for each 500-bp interval is plotted as black open points; 2-bp-interval mean r2 values are the light grey points in the background. d–f, Population genetic structure is displayed as the principal coordinates from a scaled and centred distance matrix of structural variants (d), presence–absence variants (e) and SNPs (f), colour-coded by subpopulation assignments in Fig. 3. g, Positions and −log10(P values) of the top 2,000 GWAS hits are presented for 2 gardens, the 3 subpopulations (coloured as in d–f) and an overall run (black points).

