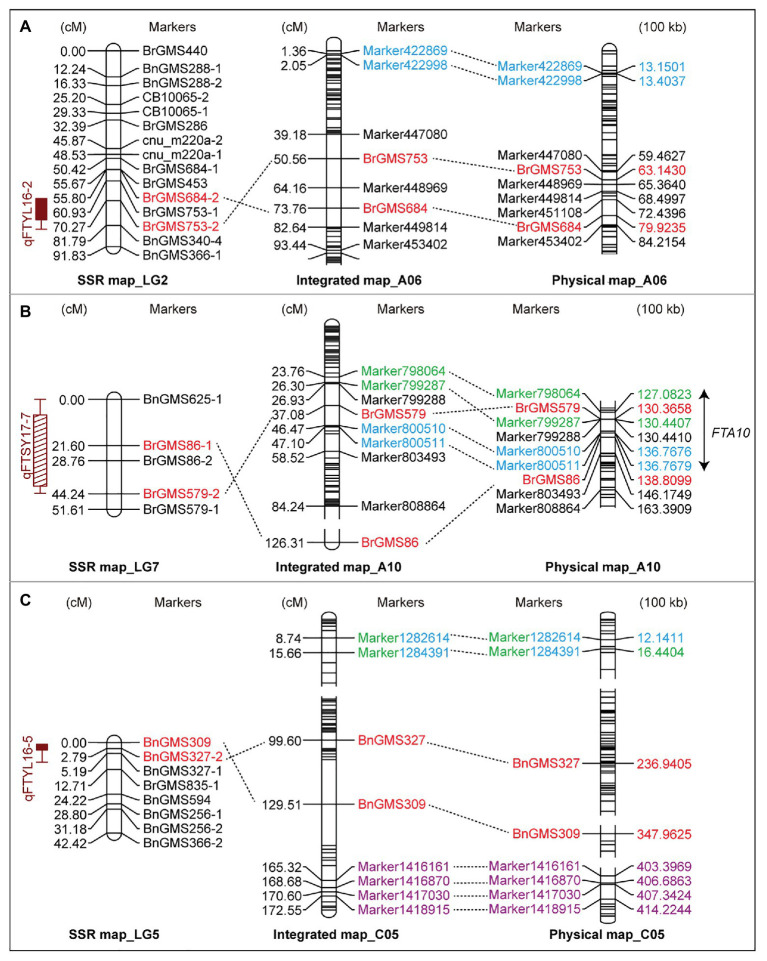
Figure 2.
The integrated linkage groups by jointing the simple sequence repeat (SSR) and specific-locus amplified fragment (SLAF) markers. The SSR-based genetic map (left), the integrated genetic map (middle), and the aligned physical map (right) in A06 (A), A10 (B), and C05 (C) chromosomes are shown. Red markers represent the loci detected on the SSR-based map using the flowering time in YL16 and SY17. Blue, green, and purple markers label the positions identified by the BOT, BUT, and FT traits in YL18 on the high-resolution genetic map (HRGM), respectively. The same markers among these maps are connected by dotted lines. The double arrow marks the co-localized interval FTA10 among these loci on A10. BOT, bolting time; BUT, budding time; FT, flowering; SY17, YL16, and YL18, the environments of Sanyuan in 2017, Yangling in 2016 and 2018.

