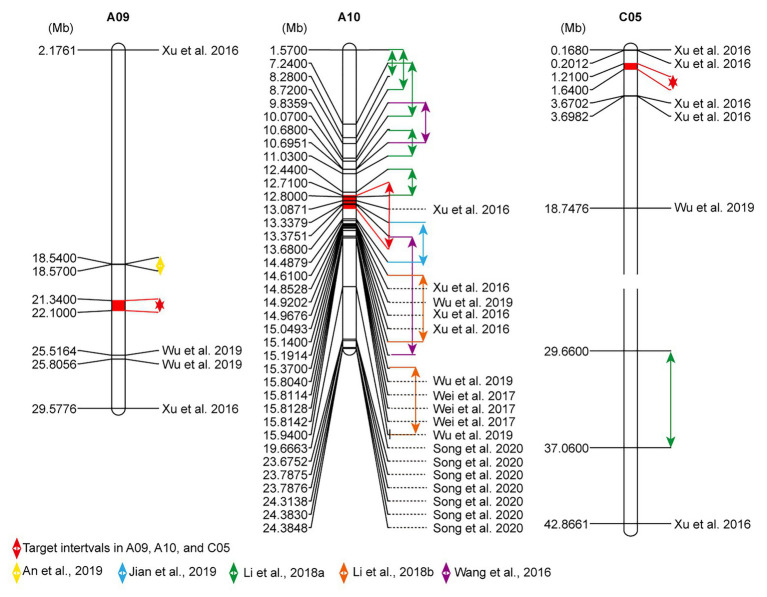
Figure 3.
Comparison of flowering-time sites of A09, A10, and C05 chromosomes between current and previous studies. The physical locations related to flowering time were arrayed by MapChart 2.2 software. The highlighted fill segments with red double arrows expose the present target intervals. Other collected QTL intervals also are annotated by double arrows, and significantly linked single nucleotide polymorphisms (SNPs) with flowering time were noted with the black reference.

