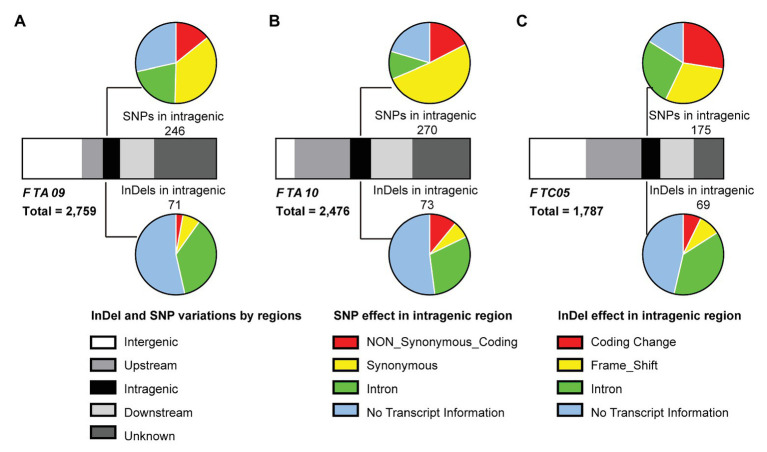
Figure 4.
Analysis of SNPs and insertion-deletions (InDels) between both parents in the three target intervals, FTA09 (A), FTA10 (B), and FTC05 (C). Strip-shape charts show the distribution of SNPs and InDels in different genomic regions. The upstream and downstream represent the 5 kb within the region of transcription start and stop sites, respectively. Pie charts show the effects of SNP (upside) and InDel (underside) in the intragenic regions. And the corresponding quantity of SNP or InDel is labeled near the pie chart.

