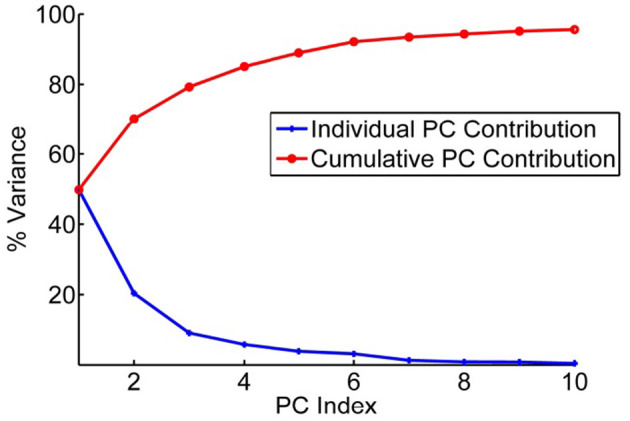
Figure 3.

Principal component contributions to the total motions of hemagglutinin. Percent of variance explained by each individual PC is shown in blue and the cumulative contribution of each PC to the total variance/motion in red. The first 5 PCs account for 90% of the total motions present in the set of 43 structures.
