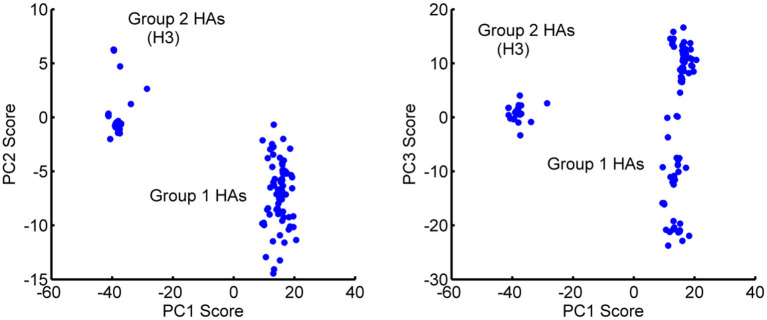
Figure 4.
Distribution of the 129 HA monomeric structures projected onto the first 3 PCs. (Left) PC2-PC1 space and (Right) PC3-PC1 space. PC1 separates the Group 1 and Group 2 hemagglutinins into different clusters. Outliers H13 and H16 have been eliminated from the figure for the sake of clarity. PC1 has a major gap between the two groups of clustered structures. PC3 appears to be populated in two somewhat similar clusters, with Group 1 showing a particularly wide range of PC3 values.

