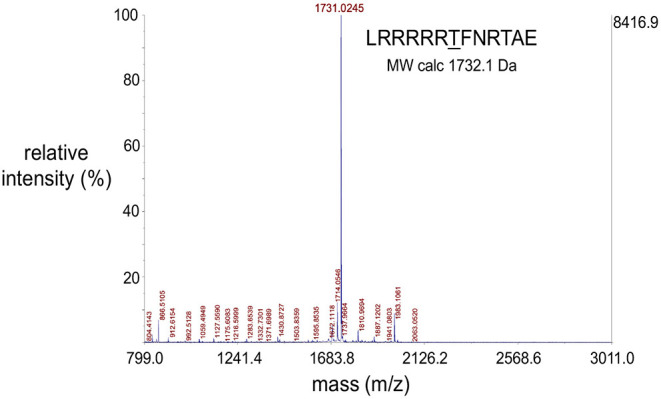
Figure 4.

Representative MALDI-TOF spectrum of a synthesized peptide substrate. MALDI-TOF mass spectrometric data were obtained using an AB Sciex 5800 TOF/TOF System, MALDI TOF (Framingham, MA, USA). Data acquisition and data processing were, respectively, done using a TOF/TOF Series Explorer and Data Explorer (both from AB Sciex). The x-axis position of the blue peaks is measured in mass/charge number of ions (m/z). Here, the charge number of ions (z) is equal to 1 and so the (m/z) value is a measure of molecule size (m, in Daltons) which corresponds to the molecular weights of the analyzed molecules. The large peak corresponding to the molecular weight of 1731.03 Da confirms the identity of the peptide substrate as well as the integrity of the solid phase peptide synthesis protocol used to synthesize the peptides. The peptide sequence and theoretical molecular weight of the peptide is indicated. The y-axis indicates intensity in percent (left) and absolute value of ion counts (right).
