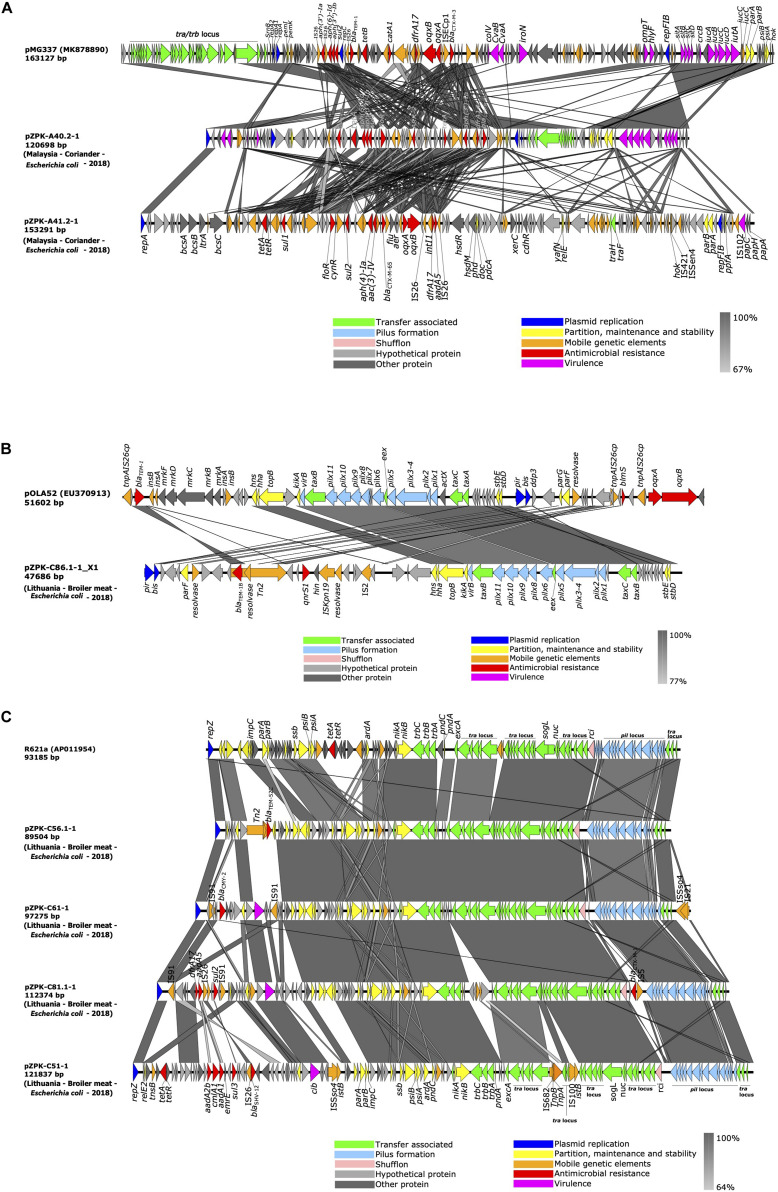
FIGURE 3.
Linear comparison of (A) IncFIB/IncFIC(FII) and IncFIB/p0111, (B) IncX1 and (C) IncI1-Iγ plasmids identified in this study with previously published plasmids (GenBank accession numbers in parentheses for reference plasmids; for plasmids identified in this study the country of origin, source, bacterial species and year of isolation is provided in parentheses). Gray areas between plasmid sequences indicate the percentage of nucleotide sequence identity. The arrows represent coding sequences and their orientation and are colored based on their predicted function.

