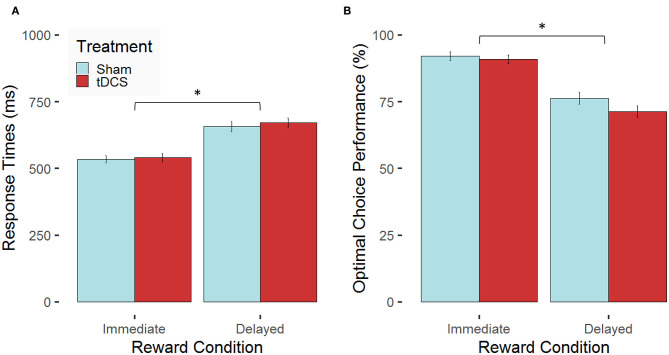
Figure 4.
Stimulation-dependent modulation of behavioral performance for the two experimental conditions. Mean values (error bars indicate 1 standard error (SE) of the mean, *p < 0.05 for post-hoc multiple comparisons after Holm correction) are indicated for (A) response times in milliseconds (ms) and (B) the proportion of optimal choices in percent (%) both separated for the two experimental conditions (immediate vs. delayed reward) for participants, who received bilateral active transcranial direct current stimulation (tDCS; red) compared with sham stimulation (blue).

