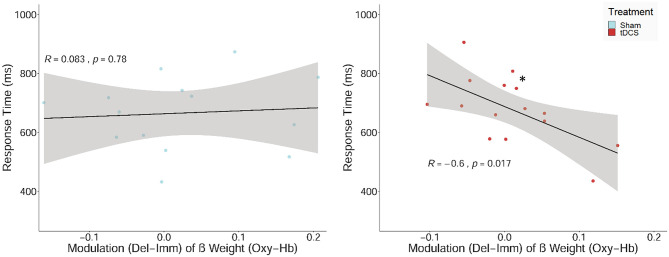
Figure 7.
Scatterplot showing the relations between the upregulation of the hemodynamic response (β values) between the two experimental conditions (delayed–immediate reward; Del-Imm) and response times in milliseconds (ms) in the delayed reward condition. Correlation including regression lines with Pearson's correlation coefficient (R), p-value (*p < 0.05), and confidence region (95%; gray area are separately shown for participants, who received sham stimulation (sham; left panel) and bilateral active transcranial direct current stimulation (tDCS; right panel).

