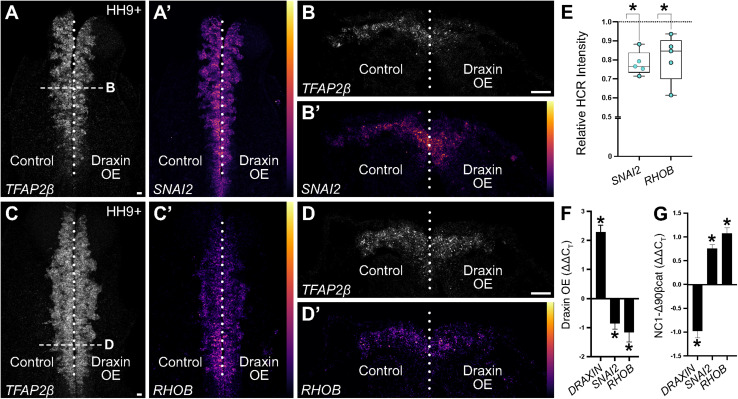
FIGURE 4.
Hybridization chain reaction (HCR) validation of identified neural crest EMT genes. (A–D) Representative images of quantitative HCR for neural crest marker TFAP2β and targets SNAI2 and RHOB in embryos bilaterally electroporated with a control (left) or Draxin overexpression (right) construct. SNAI2 and RHOB are pseudocolored based on fluorescence intensities as indicated by color scale in panels (A′–D′). (E) Integrated density measurements revealed significant downregulation of SNAI2 and RHOB (78.0 ± 2.8% of the control side for SNAI2 and 81.0 ± 5.5% of the control side for RHOB; P ≤ 0.01, one-tailed paired t-test) with Draxin overexpression. Scale bar, 20 μm. (F) ΔΔCT values from quantitative reverse transcription PCR (RT-qPCR) for DRAXIN, SNAI2, and RHOB (normalized against 18S, comparing control versus overexpression cells) from HH9+ sorted cranial neural crest cells co-electroporated with NC1.1m3 fluorescent GFP reporter with or without Draxin overexpression (DraxinOE). As expected, DRAXIN was significantly upregulated whereas SNAI2 and RHOB were significantly downregulated in DraxinOE cranial neural crest cells. *P < 0.05, two-tailed one sample t-test. (G) ΔΔCT values from quantitative reverse transcription PCR (RT-qPCR) for DRAXIN, SNAI2, and RHOB (normalized against 18S, comparing control versus Wnt-activated cells) from dissected HH9+ cranial tissue from embryos co-electroporated with NC1.1m3 fluorescent RFP reporter with or without stabilized β-catenin expression (NC1-Δ90βcat). In contrast to Wnt inhibition via DraxinOE (F), SNAI2 and RHOB were significantly upregulated with Wnt activation via NC1-Δ90βcat, whereas DRAXIN was significantly downregulated. *P ≤ 0.02, two-tailed one sample t-test.

