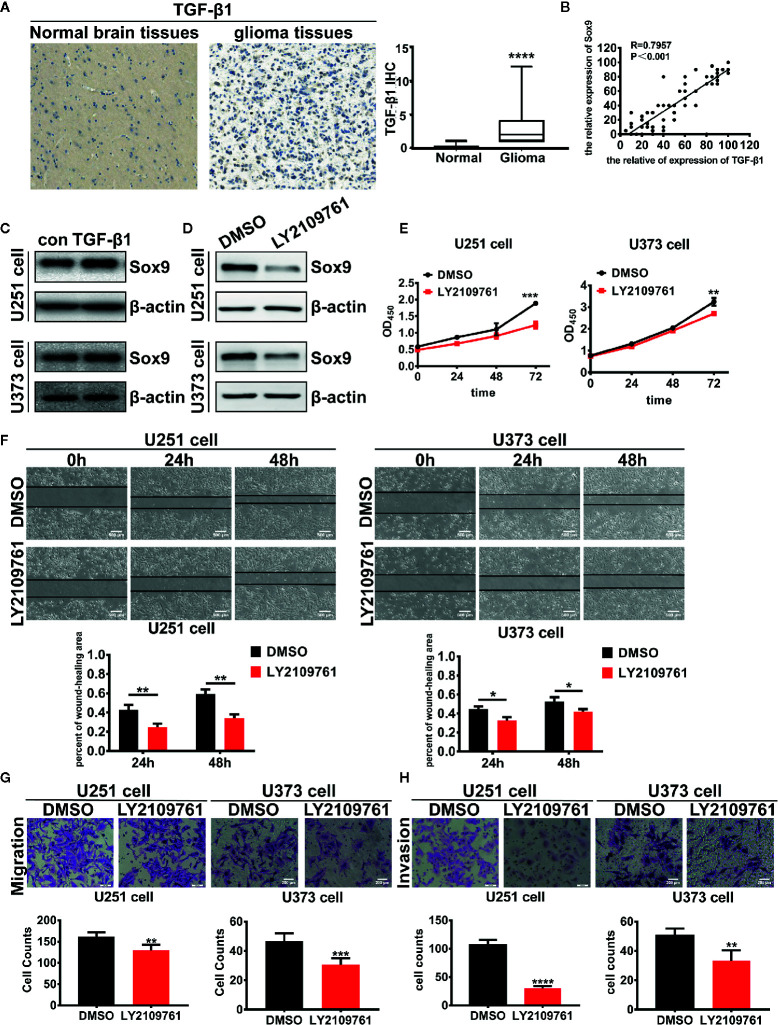
Figure 3.
Expression of TGF-β1 in 86 glioma tissues and 14 normal brain tissues were detected by immunohistochemistry (p < 0.001). (A) Analysis of the correlation of TGF-β1 and Sox9 in IHC assays (R = 0.7957). (B) Expression of Sox9 was detected by western blot after that U251 cells were treated with TGF-β1 (5 ng/ml) at 2 h and U373 cells were treated at 20 min. (C) Expression of Sox9 was detected by western blot after that U251 cells and U373 cells were treated with LY2109761 (5 μM) at 12 h. (D) CCK8 assay of both DMSO-treated U251 cells and LY2109761-treated U251 cells (p < 0.005), as well as in U373 cells (p < 0.001). (E) Wound-healing assay of both DMSO-treated U251 cells and LY2109761-treated U251 cells at 0 h, 24 h (p < 0.01), and 48 h (p < 0.01), as well as in U373 cells (24 h: p < 0.05; 48 h: p < 0.05). (F) Transwell (migration) assay in DMSO-treated U251 cells and LY2109761-treated U251 cells (p < 0.01), as well as in U373 cells (p < 0.001). (G) Transwell (invasion) assay in DMSO-treated U251 cells and LY2109761-treated U251 cells (p < 0.001), as well as in U373 cells (p < 0.01). (H) Statistical analysis was performed using a two-tailed independent t-test. Values of p < 0.05 (*), p < 0.01 (**), p < 0.005 (***), and p < 0.001 (****) were considered statistically significant.

